Technical Analysis of AVB 2024-05-10
Overview:
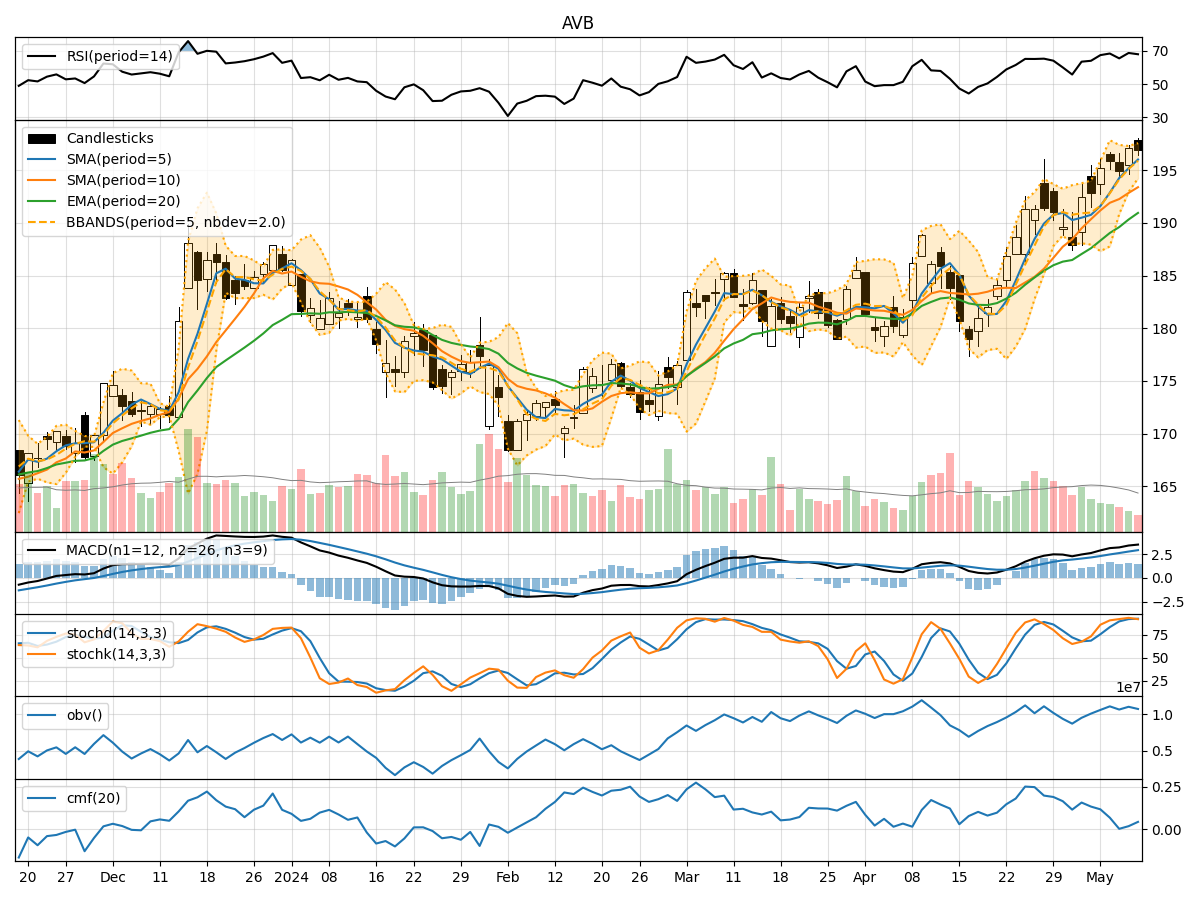
In analyzing the technical indicators for AVB over the last 5 days, we will delve into the trend, momentum, volatility, and volume indicators to provide a comprehensive outlook on the possible stock price movement in the coming days.
Trend Indicators:
- Moving Averages (MA): The 5-day MA has been consistently above the 10-day SMA, indicating a short-term bullish trend. The EMA(20) has been steadily increasing, reflecting a positive momentum in the stock price.
- MACD: The MACD line has been above the signal line, suggesting a bullish trend. The MACD histogram has been mostly positive, indicating upward momentum.
Momentum Indicators:
- RSI: The RSI has been in the overbought territory, indicating a strong bullish momentum in the stock.
- Stochastic Oscillator: Both %K and %D have been in the overbought zone, signaling a strong upward momentum.
- Williams %R: The Williams %R has been consistently in the oversold region, indicating a strong bullish sentiment.
Volatility Indicators:
- Bollinger Bands: The stock price has mostly stayed within the Bollinger Bands, with the bands narrowing in recent days, suggesting a potential decrease in volatility.
Volume Indicators:
- On-Balance Volume (OBV): The OBV has shown a positive trend, indicating that volume has been higher on days with upward price movement.
- Chaikin Money Flow (CMF): The CMF has been positive, suggesting that money is flowing into the stock.
Key Observations:
- The stock has exhibited strong bullish momentum based on RSI, Stochastic, and Williams %R indicators.
- Moving averages and MACD also support a bullish trend in the short term.
- Volatility has been relatively low, as indicated by the narrowing Bollinger Bands.
- Volume indicators show a positive trend, with increasing OBV and positive CMF.
Conclusion:
Based on the analysis of the technical indicators, the stock is likely to continue its upward momentum in the coming days. The strong bullish signals from momentum indicators, moving averages, and volume indicators suggest a potential for further price appreciation. Traders and investors may consider buying opportunities in AVB, as the technical analysis points towards a bullish outlook for the stock.