Technical Analysis of AWI 2024-05-10
Overview:
In analyzing the technical indicators for AWI over the last 5 days, we will delve into the trend, momentum, volatility, and volume indicators to provide a comprehensive outlook on the possible stock price movement in the coming days. By examining these key indicators, we aim to offer valuable insights and predictions for potential investors.
Trend Indicators:
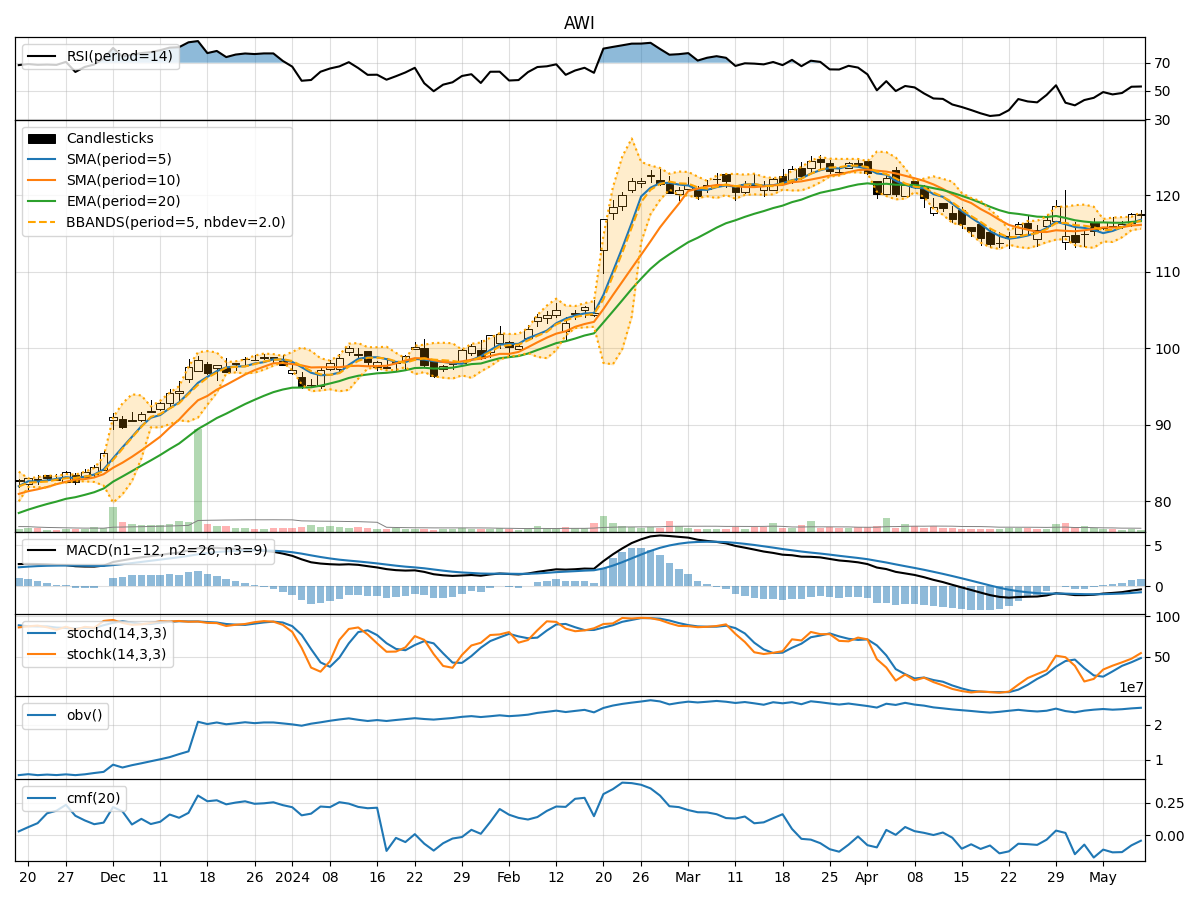
- Moving Averages (MA): The 5-day MA has been consistently above the 10-day SMA, indicating a short-term bullish trend. The EMA(20) has shown a slight upward trend, suggesting positive momentum.
- MACD: The MACD line has been gradually decreasing, but the MACD histogram is showing signs of convergence, potentially indicating a reversal in the bearish trend.
Momentum Indicators:
- RSI: The RSI has been hovering around the mid-range, indicating a neutral momentum in the stock.
- Stochastic Oscillator: Both %K and %D have been rising, suggesting increasing buying pressure. The stock is not in overbought territory yet.
Volatility Indicators:
- Bollinger Bands (BB): The stock price has been trading within the bands, with the upper and lower bands narrowing, indicating decreasing volatility.
- Bollinger %B: The %B indicator is below 1, suggesting the stock is trading below the upper Bollinger Band.
Volume Indicators:
- On-Balance Volume (OBV): The OBV has shown a slight increase over the last few days, indicating some accumulation by investors.
- Chaikin Money Flow (CMF): The CMF has been negative, indicating selling pressure in the stock.
Key Observations and Opinions:
- Trend: The stock is currently in a short-term bullish trend, supported by the moving averages and MACD convergence.
- Momentum: The momentum indicators suggest a neutral stance with a slight bullish bias, as the stock is not overbought.
- Volatility: Volatility has been decreasing, which could lead to a period of consolidation or a potential breakout.
- Volume: The volume indicators show mixed signals, with OBV slightly positive and CMF negative, indicating a divergence in investor sentiment.
Conclusion:
Based on the analysis of the technical indicators, the stock is likely to continue its upward movement in the coming days. The bullish trend supported by the moving averages and MACD convergence suggests a positive outlook. However, investors should closely monitor the momentum indicators for any signs of overbought conditions. The decreasing volatility may lead to a period of consolidation before a potential breakout. Overall, the stock shows promising signs of further upside potential.