Technical Analysis of AZEK 2024-05-10
Overview:
In analyzing the technical indicators for AZEK over the last 5 days, we will delve into the trend, momentum, volatility, and volume indicators to provide a comprehensive outlook on the possible stock price movement. By examining these key factors, we aim to offer valuable insights and predictions for the upcoming days.
Trend Analysis:
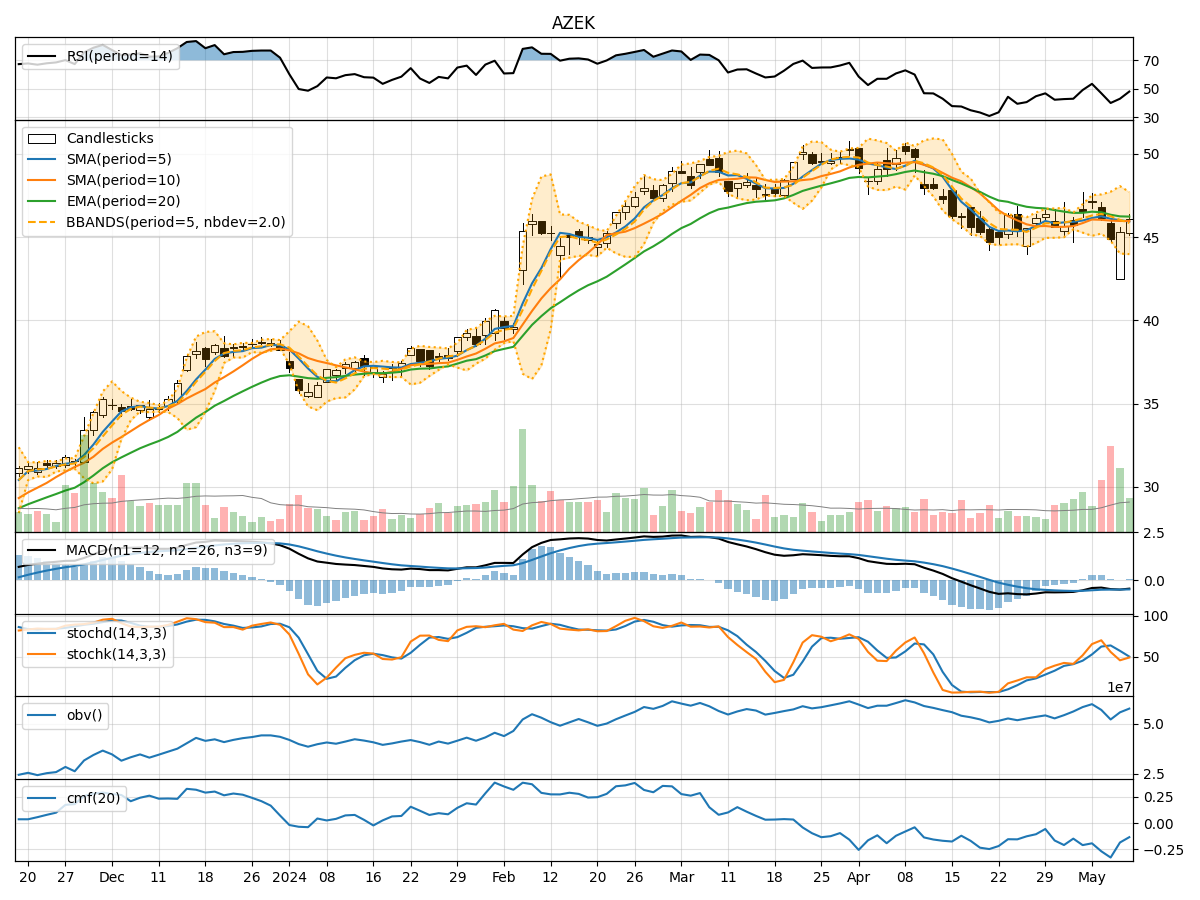
- Moving Averages (MA): The 5-day Moving Average (MA) has been fluctuating around the closing prices, indicating short-term price trends. The Simple Moving Average (SMA) and Exponential Moving Average (EMA) show a slight downward trend, suggesting a bearish sentiment.
- MACD: The Moving Average Convergence Divergence (MACD) has been negative, with the MACD line consistently below the signal line. This indicates a bearish momentum in the stock price.
- Conclusion: The trend indicators point towards a bearish outlook for AZEK in the short term.
Momentum Analysis:
- RSI: The Relative Strength Index (RSI) has been fluctuating but remains below the overbought threshold of 70, indicating a neutral to slightly bearish momentum.
- Stochastic Oscillator: Both %K and %D lines of the Stochastic Oscillator have been trending downwards, suggesting a weakening momentum.
- Conclusion: The momentum indicators suggest a neutral to bearish sentiment for AZEK in the near future.
Volatility Analysis:
- Bollinger Bands: The Bollinger Bands show a narrowing of the bands, indicating decreasing volatility in the stock price. The %B value is relatively low, suggesting a potential oversold condition.
- Conclusion: Volatility indicators signal a decreasing volatility environment for AZEK, possibly leading to a period of consolidation.
Volume Analysis:
- On-Balance Volume (OBV): The OBV has been fluctuating, indicating mixed buying and selling pressure. The recent negative OBV values suggest a slight increase in selling pressure.
- Chaikin Money Flow (CMF): The CMF has been negative, indicating a bearish money flow trend.
- Conclusion: Volume indicators reflect a mixed sentiment with a slight bearish bias in the trading activity for AZEK.
Overall Conclusion:
Based on the analysis of trend, momentum, volatility, and volume indicators, the overall outlook for AZEK in the next few days appears to be bearish. The trend indicators suggest a downward trajectory, while momentum indicators point towards a neutral to bearish sentiment. Volatility is decreasing, indicating a potential consolidation phase, and volume indicators show mixed signals with a slight bearish bias.
Recommendation:
Considering the comprehensive analysis of technical indicators, it is advisable to exercise caution when trading AZEK in the upcoming days. Investors may consider adopting a wait-and-see approach or implementing risk management strategies to navigate the potential bearish market conditions. Monitoring key support levels and waiting for a clear reversal signal could provide better entry points for traders looking to capitalize on any potential price movements.
Disclaimer:
Please note that market dynamics can change rapidly, and it is essential to stay updated with real-time data and market developments. Technical analysis provides insights based on historical data and indicators, but it is not a guaranteed predictor of future price movements. Conducting thorough research and considering fundamental factors alongside technical analysis is crucial for making well-informed investment decisions.