Technical Analysis of BALL 2024-05-10
Overview:
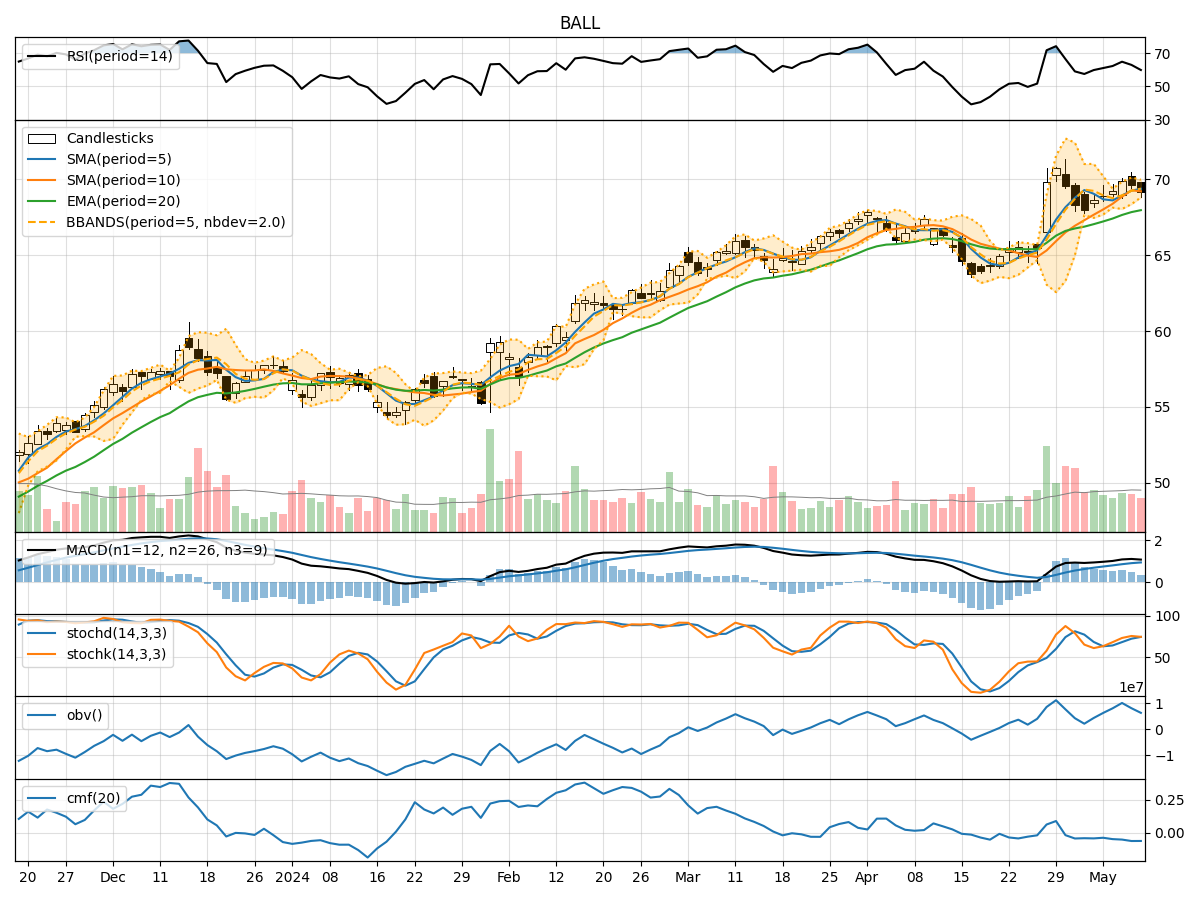
In analyzing the technical indicators for BALL stock over the last 5 days, we will delve into the trend, momentum, volatility, and volume indicators to provide a comprehensive outlook on the possible stock price movement in the coming days.
Trend Analysis:
- Moving Averages (MA): The 5-day Moving Average (MA) has been consistently above the Simple Moving Average (SMA) and Exponential Moving Average (EMA), indicating a bullish trend.
- MACD: The MACD line has been above the signal line, with both lines showing an upward trend, suggesting bullish momentum.
- RSI: The Relative Strength Index (RSI) has been fluctuating around the 60-70 range, indicating a neutral to slightly bullish sentiment.
Momentum Analysis:
- Stochastic Oscillator: The Stochastic Oscillator has been in the overbought territory, suggesting a potential reversal or consolidation.
- Williams %R: The Williams %R indicator has been hovering in the oversold region, indicating a possible buying opportunity.
Volatility Analysis:
- Bollinger Bands: The Bollinger Bands have been relatively narrow, indicating low volatility in the stock price movement.
- Average True Range (ATR): The ATR has shown a decrease in volatility over the last few days.
Volume Analysis:
- On-Balance Volume (OBV): The OBV indicator has been declining, suggesting a decrease in buying pressure.
- Chaikin Money Flow (CMF): The CMF has been negative, indicating a bearish money flow trend.
Conclusion:
Based on the analysis of the technical indicators, the stock is currently in a consolidation phase with neutral to slightly bullish sentiment. The momentum indicators suggest a potential reversal or consolidation in the short term. The volatility is low, indicating a lack of significant price movements. The volume indicators point towards a decrease in buying pressure.
Forecast:
Given the current technical outlook, the stock is likely to continue trading in a sideways pattern in the next few days. Traders should exercise caution and wait for clearer signals before taking any significant positions. It is advisable to monitor key support and resistance levels for potential breakout or breakdown scenarios.
Disclaimer:
Remember that technical analysis is not a guaranteed predictor of future price movements, and other fundamental factors can influence stock prices. It is essential to conduct thorough research and consider multiple indicators before making any investment decisions. Consulting with a financial advisor is recommended for personalized investment advice.