Technical Analysis of BBAR 2024-05-10
Overview:
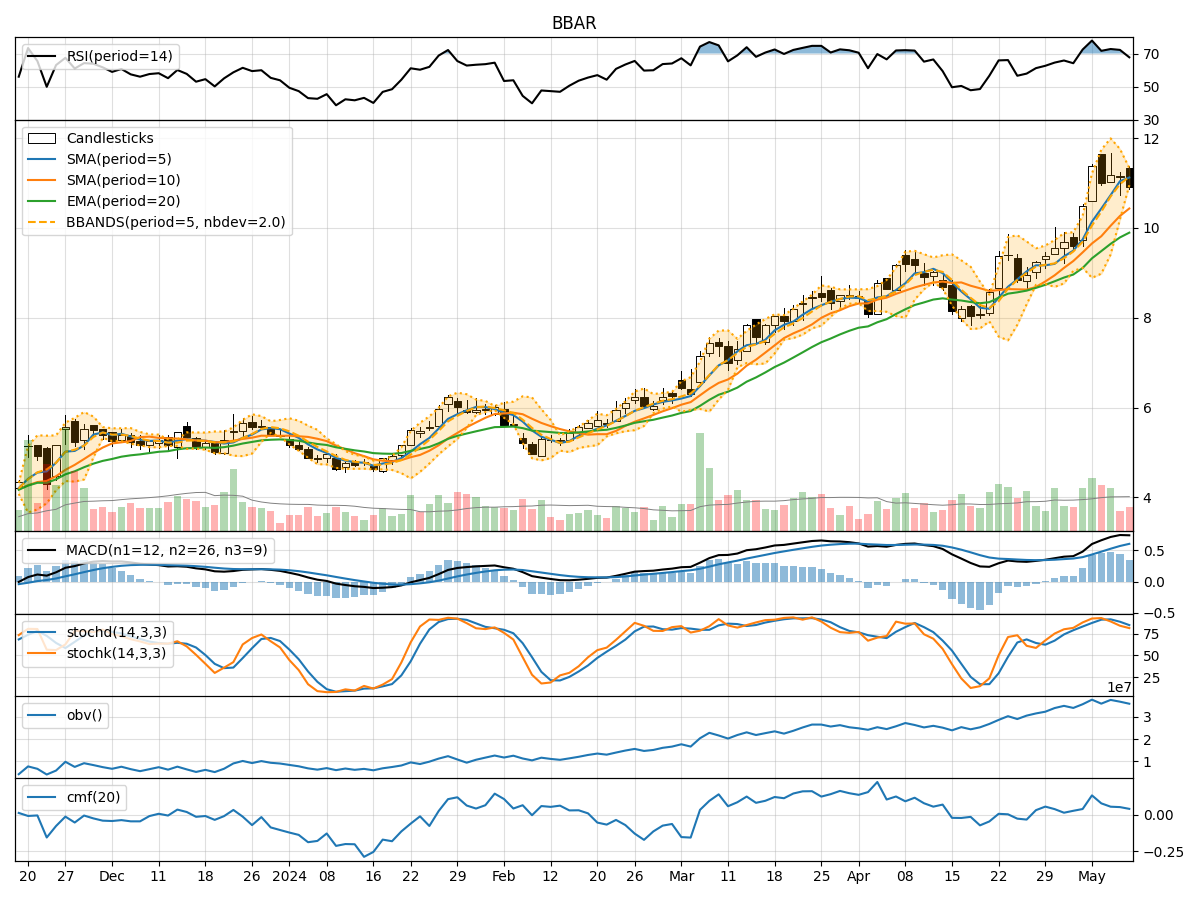
In analyzing the technical indicators for BBAR over the last 5 days, we will delve into the trend, momentum, volatility, and volume indicators to provide a comprehensive outlook on the possible stock price movement. By examining these key aspects, we aim to offer valuable insights and predictions for the upcoming days.
Trend Indicators:
- Moving Averages (MA): The 5-day moving average has been consistently above the longer-term moving averages (SMA and EMA), indicating a bullish trend.
- MACD: The MACD line has been above the signal line, with both lines showing an upward trend, suggesting bullish momentum.
- Conclusion: The trend indicators point towards an upward trajectory for BBAR.
Momentum Indicators:
- RSI: The RSI has been in the overbought territory but has shown some signs of consolidation in the recent days.
- Stochastic Oscillator: Both %K and %D have been gradually decreasing, indicating a potential shift towards a bearish momentum.
- Conclusion: The momentum indicators suggest a potential reversal or sideways movement in the near future.
Volatility Indicators:
- Bollinger Bands (BB): The bands have been narrowing, indicating decreasing volatility.
- Conclusion: The volatility indicators suggest a decrease in volatility and a possible period of consolidation.
Volume Indicators:
- On-Balance Volume (OBV): The OBV has shown a slight decrease over the last few days, indicating some selling pressure.
- Chaikin Money Flow (CMF): The CMF has also decreased but remains positive, suggesting overall buying pressure.
- Conclusion: The volume indicators imply a mixed sentiment with a slight bias towards selling pressure.
Conclusion:
Based on the analysis of the technical indicators, the next few days for BBAR could see a mixed price movement. The trend indicators signal an upward trajectory, while momentum indicators hint at a potential reversal or sideways movement. Volatility indicators point towards a decrease in volatility and a period of consolidation. Volume indicators suggest a mixed sentiment with a slight bias towards selling pressure.
Recommendation:
Considering the overall analysis, it is advisable to exercise caution in trading BBAR in the upcoming days. Traders may consider waiting for clearer signals or implementing risk management strategies to navigate the potential mixed price movement. Monitoring key levels and waiting for confirmation of a new trend direction could provide better trading opportunities.
Disclaimer:
Remember that technical analysis is not a guaranteed predictor of future price movements, and other fundamental factors can influence stock prices. It is essential to conduct thorough research and consider multiple indicators before making any trading decisions. Consulting with a financial advisor or conducting further analysis based on real-time data is recommended for making informed investment choices.