Technical Analysis of BBU 2024-05-10
Overview:
In analyzing the technical indicators for BBU stock over the last 5 days, we will delve into the trend, momentum, volatility, and volume indicators to provide a comprehensive outlook on the possible future stock price movement. By examining these key indicators, we aim to offer valuable insights and predictions for the upcoming trading days.
Trend Analysis:
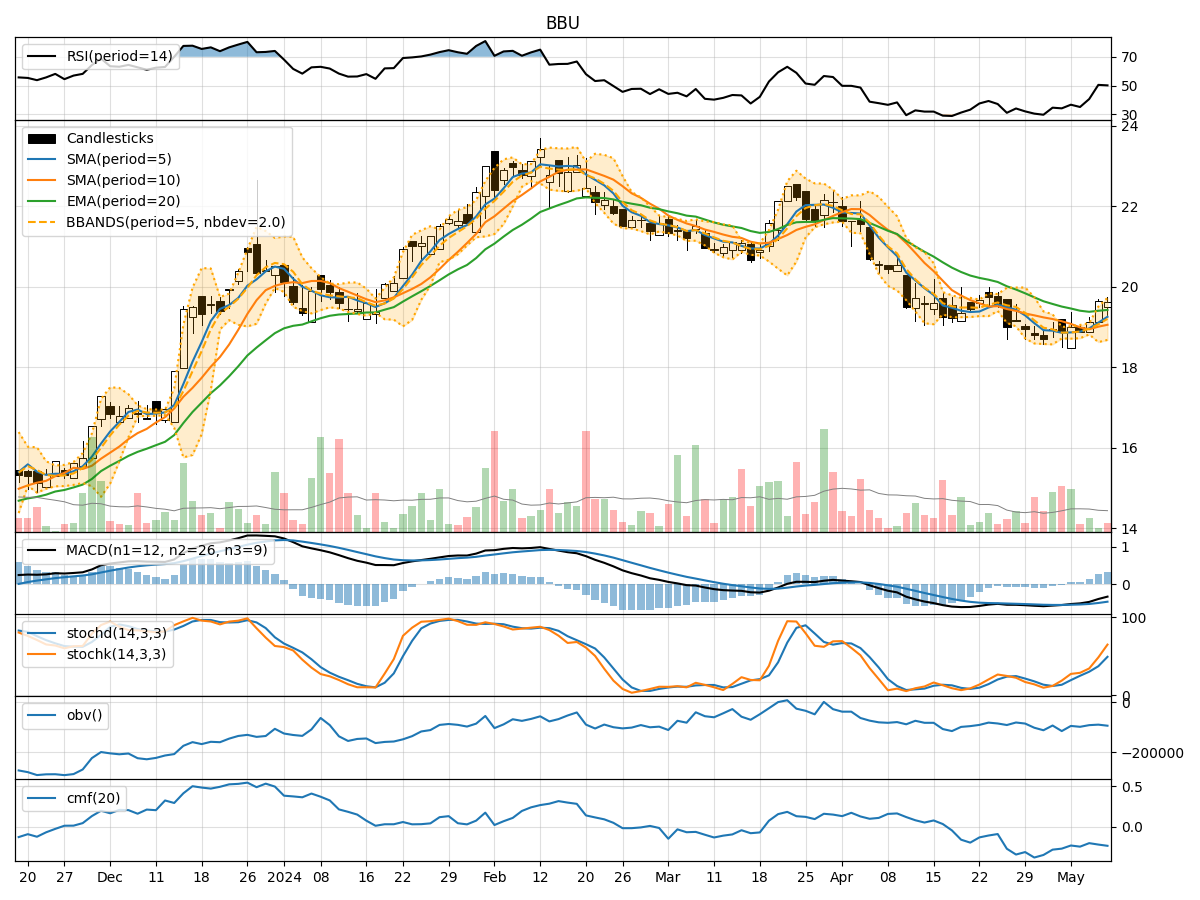
- Moving Averages (MA): The 5-day MA has been fluctuating around the closing prices, indicating short-term price trends. The SMA(10) and EMA(20) have shown a slight downward trend, suggesting a potential bearish sentiment.
- MACD and Signal Line: The MACD has been negative, with the MACD line consistently below the signal line. This indicates a bearish momentum in the stock price.
- Conclusion: The trend indicators suggest a bearish outlook for BBU stock in the short term.
Momentum Analysis:
- RSI: The RSI has been relatively low, indicating a lack of strong buying momentum in the stock.
- Stochastic Oscillator: The Stochastic indicators have shown mixed signals, with the %K and %D lines fluctuating. However, the %K line has crossed above the %D line, suggesting a potential bullish momentum.
- Williams %R: The Williams %R has been in the oversold territory, indicating a potential reversal in the stock price.
- Conclusion: The momentum indicators provide a mixed signal, with a slight bullish bias emerging.
Volatility Analysis:
- Bollinger Bands: The Bollinger Bands have widened, indicating increased volatility in the stock price. The price has been hovering around the upper band, suggesting a potential overbought condition.
- Conclusion: The volatility indicators point towards increased volatility and a potential overbought scenario.
Volume Analysis:
- On-Balance Volume (OBV): The OBV has shown a slight decline, indicating a decrease in buying volume.
- Chaikin Money Flow (CMF): The CMF has been negative, suggesting a lack of buying pressure in the stock.
- Conclusion: The volume indicators reflect a bearish sentiment with decreasing buying volume.
Overall Conclusion:
Based on the analysis of trend, momentum, volatility, and volume indicators, the overall outlook for BBU stock in the next few days leans towards a bearish sentiment. The trend indicators signal a bearish trend, while the momentum indicators provide a mixed but slightly bullish bias. The volatility indicators point towards an overbought scenario, and the volume indicators indicate a lack of buying pressure.
Recommendation:
Considering the comprehensive analysis of the technical indicators, it is advisable to exercise caution with BBU stock in the upcoming trading days. Investors may consider waiting for more clarity in the price action before making any significant trading decisions. Short-term traders could potentially benefit from a bearish stance, while long-term investors may find it prudent to wait for a more favorable entry point.
Disclaimer:
Please note that technical analysis is not a guaranteed predictor of future price movements, and market dynamics can change rapidly. It is essential to conduct thorough research and consider multiple factors before making any investment decisions. Consulting with a financial advisor is recommended to tailor strategies to individual investment goals and risk tolerance levels.