Technical Analysis of BBWI 2024-05-10
Overview:
In analyzing the technical indicators for BBWI over the last 5 days, we will delve into the trend, momentum, volatility, and volume indicators to provide a comprehensive outlook on the possible stock price movement. By examining these key factors, we aim to offer valuable insights and predictions for the upcoming days.
Trend Analysis:
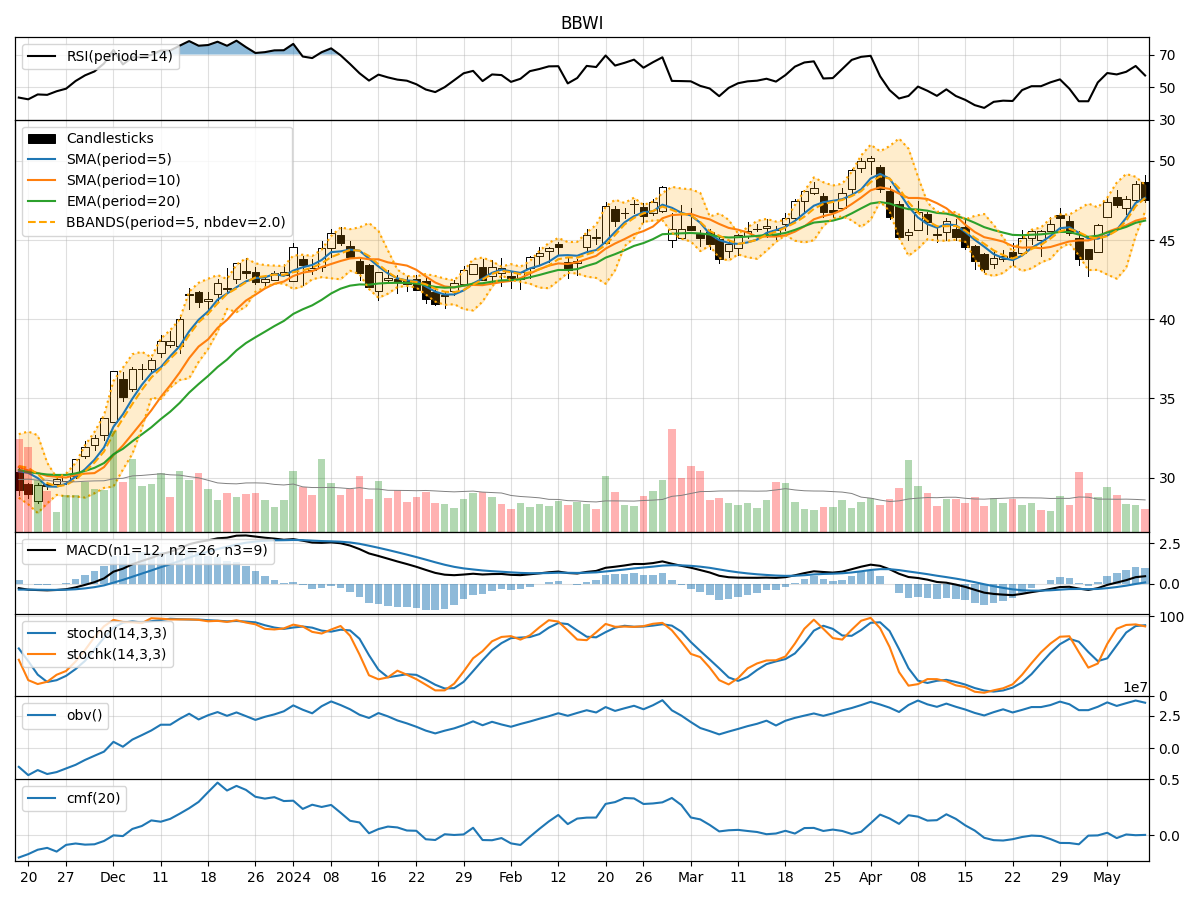
- Moving Averages (MA): The 5-day Moving Average (MA) has been consistently above the Simple Moving Average (SMA) and Exponential Moving Average (EMA), indicating a bullish trend.
- MACD: The MACD line has been above the signal line for the past few days, suggesting positive momentum in the stock price.
- RSI: The Relative Strength Index (RSI) has been fluctuating around the 50 level, indicating a neutral stance in terms of overbought or oversold conditions.
Momentum Analysis:
- Stochastic Oscillator: The Stochastic Oscillator has been in the overbought territory, signaling potential selling pressure in the stock.
- Williams %R: The Williams %R indicator has been consistently in the oversold region, suggesting a bearish sentiment in the market.
Volatility Analysis:
- Bollinger Bands: The Bollinger Bands have been narrowing, indicating decreasing volatility in the stock price.
- Average True Range (ATR): The ATR values have been relatively stable, suggesting a lack of significant price fluctuations.
Volume Analysis:
- On-Balance Volume (OBV): The OBV has shown mixed signals, with fluctuations in volume accumulation.
- Chaikin Money Flow (CMF): The CMF has been hovering around the zero line, indicating a balance between buying and selling pressure.
Key Observations:
- The trend indicators suggest a bullish outlook, supported by the MACD and moving averages.
- Momentum indicators show conflicting signals, with the Stochastic Oscillator indicating overbought conditions and the Williams %R signaling oversold sentiment.
- Volatility remains relatively low, as indicated by the narrowing Bollinger Bands.
- Volume indicators reflect mixed signals, with no clear trend in volume accumulation.
Conclusion:
Based on the analysis of the technical indicators, the stock price of BBWI is likely to experience a period of consolidation in the upcoming days. The conflicting signals from the momentum indicators and the lack of significant volatility suggest a sideways movement in the stock price. Traders may expect the stock to trade within a range with no clear directional bias. It is advisable to closely monitor the key support and resistance levels for potential breakout opportunities.