Technical Analysis of BC 2024-05-10
Overview:
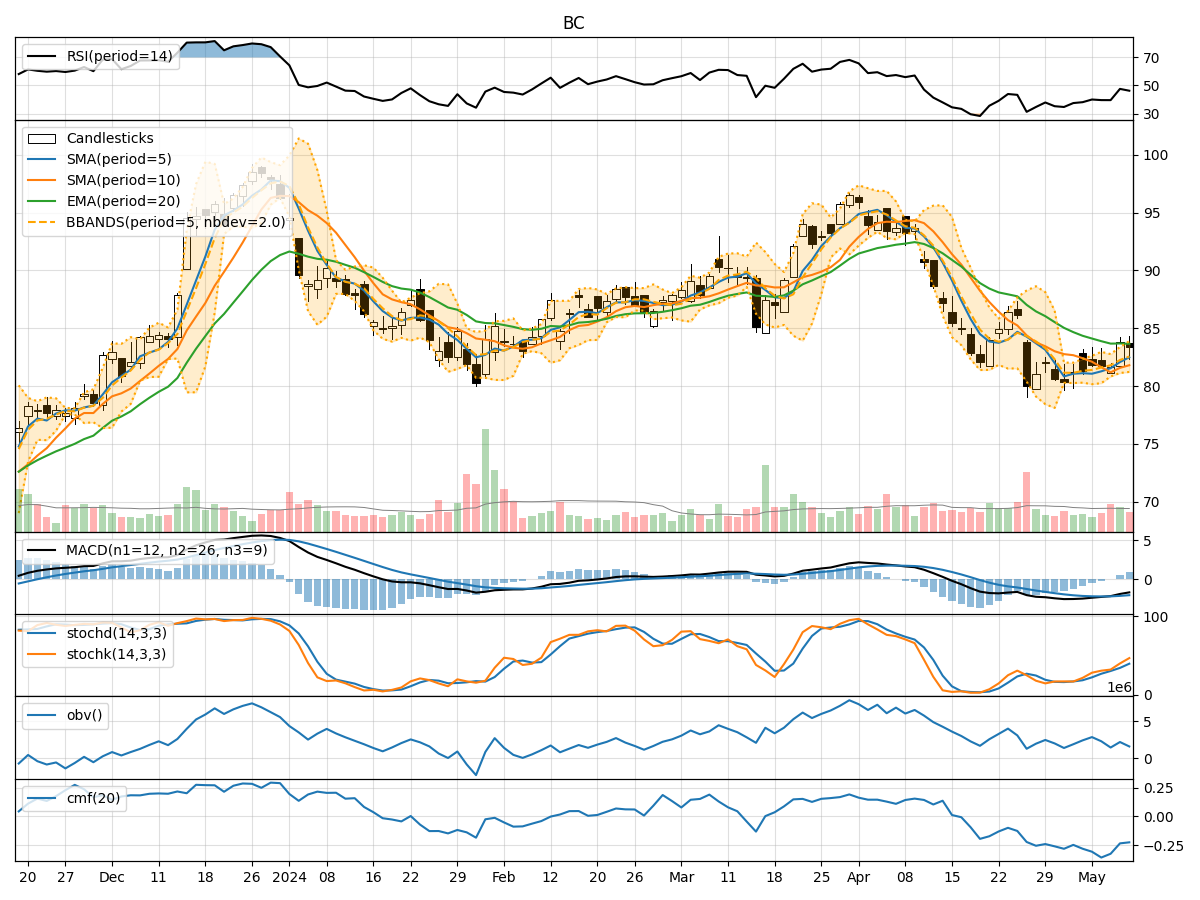
In analyzing the technical indicators for BC stock over the last 5 days, we will delve into the trend, momentum, volatility, and volume indicators to provide a comprehensive outlook on the possible stock price movement in the coming days. By examining these key indicators, we aim to offer valuable insights and recommendations for potential investors.
Trend Analysis:
- Moving Averages (MA): The 5-day MA has been showing an upward trend, indicating a positive momentum in the stock price.
- MACD: The MACD line has been consistently below the signal line, suggesting a bearish trend in the short term.
- RSI: The RSI has been fluctuating around the neutral zone, indicating a lack of strong momentum in either direction.
Momentum Analysis:
- Stochastic Oscillator: The Stochastic Oscillator has been rising, reaching overbought levels, which could signal a potential reversal in the stock price.
- Williams %R: The Williams %R indicator has been hovering around oversold levels, indicating a possible buying opportunity.
Volatility Analysis:
- Bollinger Bands: The Bollinger Bands have been widening, suggesting increased volatility in the stock price.
- Average True Range (ATR): The ATR has been relatively stable, indicating consistent price movements without significant spikes.
Volume Analysis:
- On-Balance Volume (OBV): The OBV has been fluctuating, indicating mixed sentiment among investors.
- Chaikin Money Flow (CMF): The CMF has been negative, suggesting a net outflow of money from the stock.
Key Observations:
- The stock is currently in a sideways consolidation phase, as indicated by the mixed signals from various indicators.
- The volatility has increased slightly, which could lead to larger price swings in the coming days.
- The momentum indicators are conflicting, with the Stochastic Oscillator signaling overbought conditions while the Williams %R indicating oversold levels.
Conclusion:
Based on the analysis of the technical indicators, the next few days for BC stock are likely to see sideways movement with increased volatility. Investors should exercise caution and closely monitor key levels such as support and resistance to make informed trading decisions. The conflicting signals from momentum indicators suggest a lack of clear direction, emphasizing the importance of risk management strategies in the current market environment.