Technical Analysis of BCSF 2024-05-10
Overview:
In analyzing the technical indicators for BCSF over the last 5 days, we will delve into the trend, momentum, volatility, and volume indicators to provide a comprehensive outlook on the possible stock price movement in the coming days.
Trend Analysis:
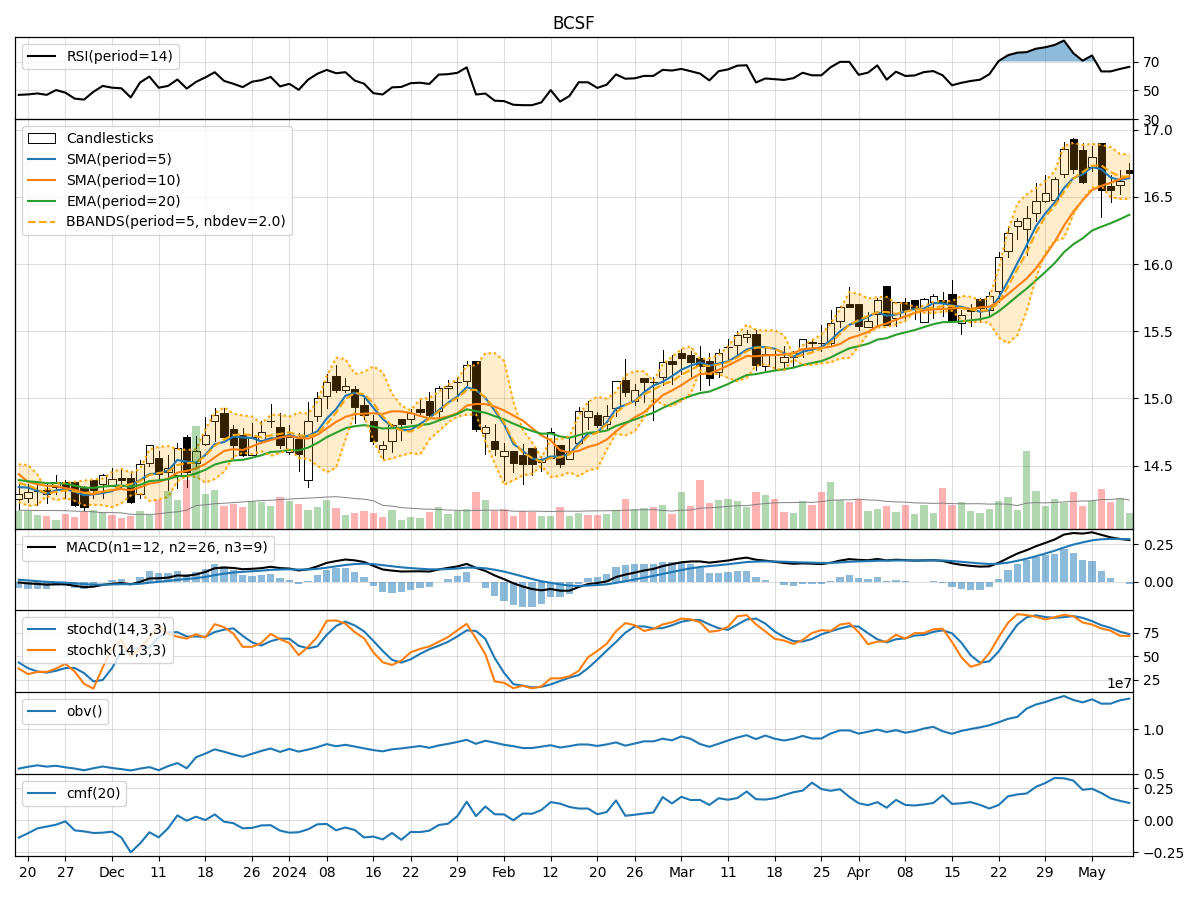
- Moving Averages (MA): The 5-day Moving Average (MA) has been fluctuating around the closing prices, indicating short-term price trends.
- MACD: The Moving Average Convergence Divergence (MACD) has been positive, suggesting a bullish momentum.
- EMA: The Exponential Moving Average (EMA) has been steadily increasing, reflecting a positive trend.
Key Observation: The trend indicators suggest a bullish sentiment in the short term.
Momentum Analysis:
- RSI: The Relative Strength Index (RSI) has been in the overbought territory, indicating a potential reversal or consolidation.
- Stochastic Oscillator: Both %K and %D have been declining, signaling a potential bearish momentum.
- Williams %R: The Williams %R has been in the oversold region, suggesting a possible reversal.
Key Observation: The momentum indicators show a mixed signal with a slight bearish bias.
Volatility Analysis:
- Bollinger Bands (BB): The Bollinger Bands have been narrowing, indicating decreasing volatility.
- BB %B: The %B indicator has been hovering around the midline, suggesting a balanced market sentiment.
Key Observation: Volatility indicators point towards a consolidation phase with reduced price fluctuations.
Volume Analysis:
- On-Balance Volume (OBV): The OBV has shown mixed movements, indicating indecision among market participants.
- Chaikin Money Flow (CMF): The CMF has been declining, suggesting a potential outflow of money from the stock.
Key Observation: Volume indicators reflect uncertainty in market participation and potential selling pressure.
Conclusion:
Based on the analysis of trend, momentum, volatility, and volume indicators, the next few days' possible stock price movement for BCSF is likely to be sideways with a slight bearish bias. While the trend indicators signal a bullish sentiment, the momentum indicators show a mixed outlook with a bearish bias. Volatility indicators point towards a consolidation phase, and volume indicators indicate uncertainty and potential selling pressure.
Overall, the stock is expected to trade within a narrow range with a tendency towards a slight downward movement. Traders should exercise caution and closely monitor key support and resistance levels for potential entry and exit points.