Technical Analysis of BDX 2024-05-10
Overview:
In analyzing the technical indicators for Becton, Dickinson and Company (BDX) over the last 5 days, we will delve into the trend, momentum, volatility, and volume indicators to provide a comprehensive outlook on the possible stock price movement in the coming days.
Trend Analysis:
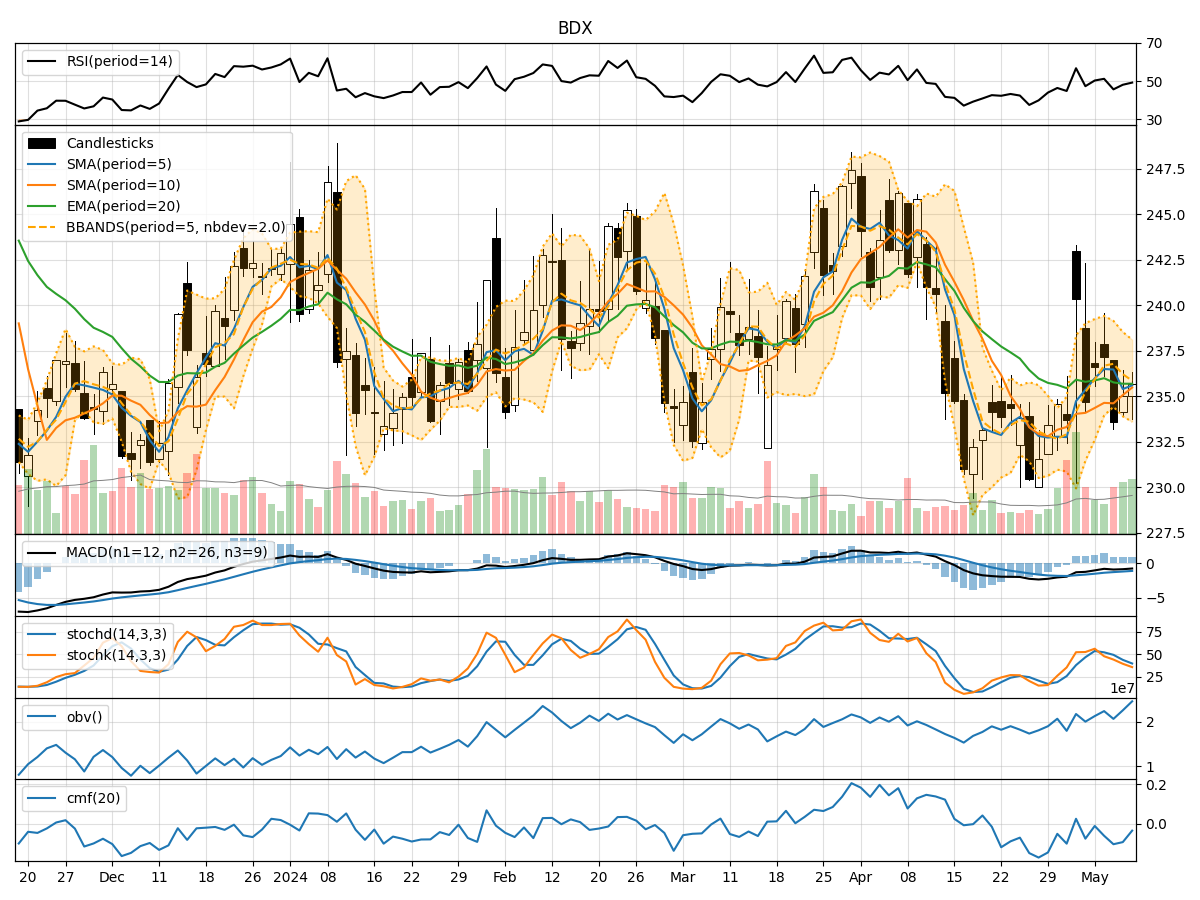
- Moving Averages (MA): The 5-day Moving Average (MA) has been fluctuating around the closing prices, indicating short-term price trends. The Simple Moving Average (SMA) and Exponential Moving Average (EMA) have been relatively close, suggesting stability in the mid to long-term trends.
- MACD: The Moving Average Convergence Divergence (MACD) has shown positive values, indicating a potential bullish trend. The MACD Histogram (MACDH) has been consistently above the signal line, further supporting a bullish sentiment.
Momentum Analysis:
- RSI: The Relative Strength Index (RSI) has been hovering around the neutral zone, indicating a balanced momentum between buying and selling pressure.
- Stochastic Oscillator: Both %K and %D have been declining, suggesting a potential bearish momentum in the short term.
- Williams %R: The Williams %R is in the oversold region, indicating a possible reversal in the downward momentum.
Volatility Analysis:
- Bollinger Bands (BB): The Bollinger Bands have been narrowing, indicating decreasing volatility. The bands are relatively close to the moving average, suggesting a period of consolidation.
Volume Analysis:
- On-Balance Volume (OBV): The OBV has shown mixed signals, with fluctuations in volume accumulation. This indicates indecision among market participants.
- Chaikin Money Flow (CMF): The CMF has been negative, indicating selling pressure in the market.
Key Observations:
- The trend indicators suggest a potential bullish sentiment in the mid to long term.
- Momentum indicators show a mixed picture with a slight bearish bias in the short term.
- Volatility is decreasing, indicating a period of consolidation.
- Volume indicators reflect indecision among investors, with selling pressure evident.
Conclusion:
Based on the analysis of the technical indicators, the stock price of BDX is likely to experience sideways movement in the coming days. The bullish trend indicated by the moving averages and MACD may be hindered by the bearish momentum suggested by the stochastic oscillator. The narrowing Bollinger Bands and mixed volume indicators further support the view of consolidation. Traders should exercise caution and closely monitor key support and resistance levels for potential breakout opportunities.
Recommendation:
Given the current market dynamics, it is advisable for investors to wait for a clear trend confirmation before making significant trading decisions. Monitoring key technical levels and staying informed about any significant news or events that may impact the stock price is crucial. Consider implementing risk management strategies to protect against unexpected market movements.