Technical Analysis of BEDU 2024-05-10
Overview:
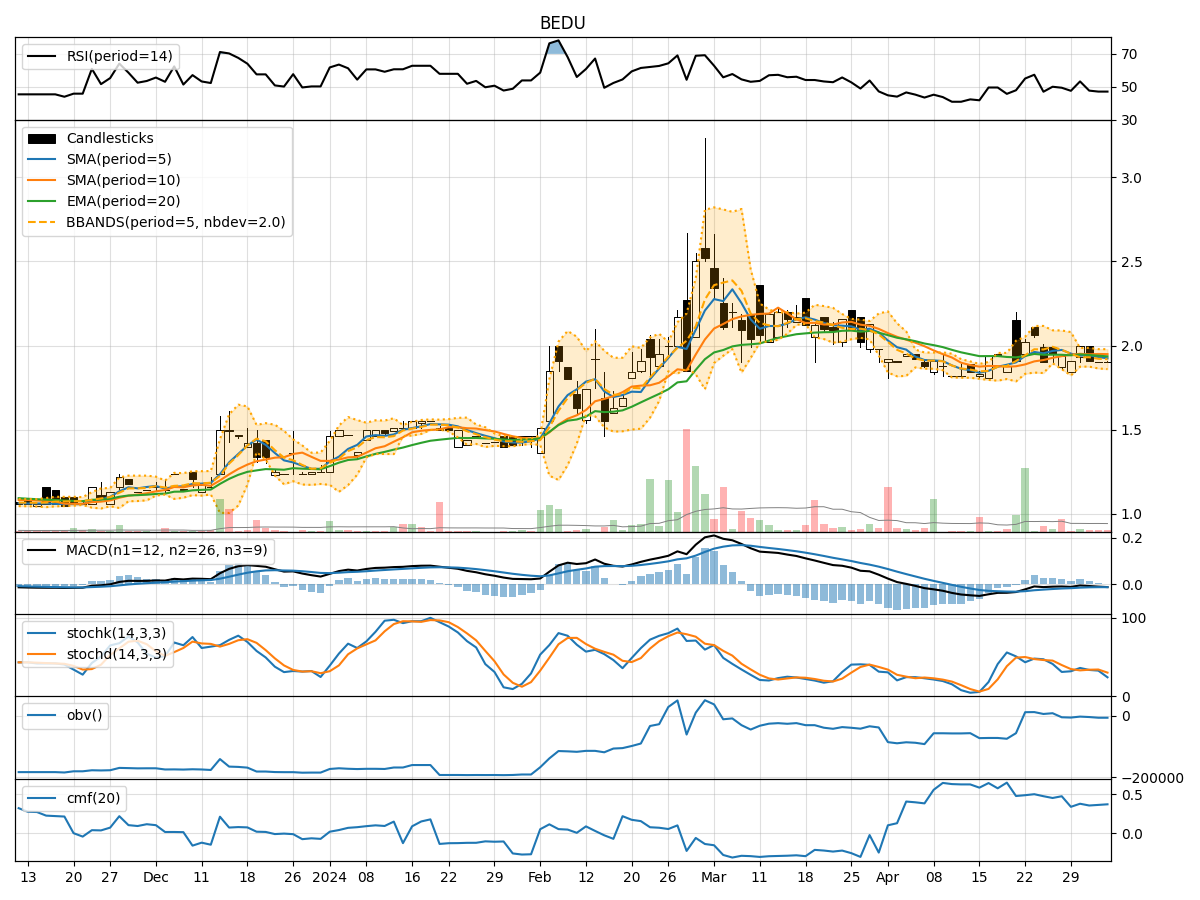
In analyzing the technical indicators for BEDU over the last 5 days, we will delve into the trend, momentum, volatility, and volume indicators to provide a comprehensive assessment of the stock's potential price movement. By examining these key factors, we aim to offer valuable insights and predictions for the next few days.
Trend Analysis:
- The Moving Average (MA) indicators show a slight downward trend, with the 5-day MA consistently below the 10-day Simple Moving Average (SMA).
- The Exponential Moving Average (EMA) indicates a relatively stable trend around the $1.93-$1.94 range.
- The Moving Average Convergence Divergence (MACD) is negative, suggesting a bearish momentum in the short term.
Momentum Analysis:
- The Relative Strength Index (RSI) is hovering around the neutral zone, indicating a lack of strong momentum in either direction.
- The Stochastic Oscillator shows mixed signals, with the %K line fluctuating within a range and the %D line showing some divergence.
- The Williams %R (WILLR) is in oversold territory, suggesting a potential reversal or consolidation.
Volatility Analysis:
- The Bollinger Bands (BB) are relatively narrow, indicating low volatility in the stock price.
- The %B indicator is below 1, suggesting the price is trading below the lower Bollinger Band, potentially indicating an oversold condition.
Volume Analysis:
- On-Balance Volume (OBV) has been relatively flat, indicating a balance between buying and selling pressure.
- The Chaikin Money Flow (CMF) is positive but trending downwards, signaling a decrease in buying pressure.
Key Observations:
- The stock is currently in a consolidation phase, with limited price movement and low volatility.
- Momentum indicators suggest a lack of strong directional bias, indicating a potential period of indecision in the market.
- Volume indicators show a lack of significant accumulation or distribution, pointing to a balanced market sentiment.
Conclusion:
Based on the analysis of the technical indicators, the next few days for BEDU are likely to see sideways movement with a slight bearish bias. The stock is expected to continue trading within the current range of $1.88-$1.94, with limited volatility and momentum. Traders may consider waiting for a clearer trend confirmation before making significant trading decisions.