Technical Analysis of BEN 2024-05-10
Overview:
In analyzing the technical indicators for BEN over the last 5 days, we will delve into the trend, momentum, volatility, and volume indicators to provide a comprehensive outlook on the possible stock price movement. By examining these key factors, we aim to offer valuable insights and predictions for the upcoming days.
Trend Analysis:
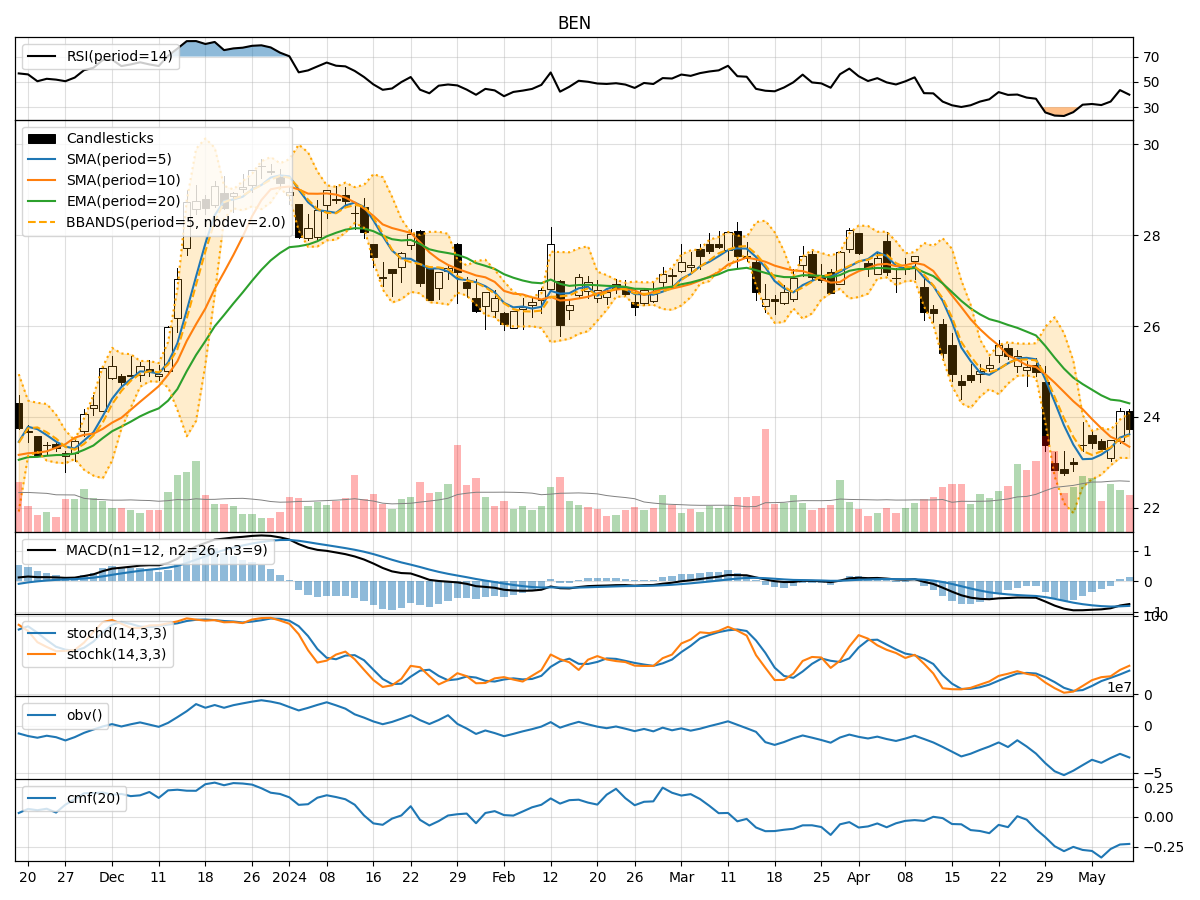
- Moving Averages (MA): The 5-day Moving Average (MA) has been fluctuating around the closing prices, indicating short-term price trends. The Simple Moving Average (SMA) and Exponential Moving Average (EMA) show a downward trend, with the EMA indicating a more extended bearish sentiment.
- MACD: The Moving Average Convergence Divergence (MACD) and its signal line have been negative, suggesting a bearish trend in the stock price.
Momentum Analysis:
- RSI: The Relative Strength Index (RSI) has been below 50, indicating bearish momentum in the stock.
- Stochastic Oscillator: Both %K and %D lines of the Stochastic Oscillator are below 50, further confirming the bearish momentum.
Volatility Analysis:
- Bollinger Bands (BB): The Bollinger Bands have been narrowing, indicating decreasing volatility in the stock price.
Volume Analysis:
- On-Balance Volume (OBV): The OBV has been declining, suggesting a decrease in buying pressure.
- Chaikin Money Flow (CMF): The CMF has been negative, indicating a lack of buying interest in the stock.
Key Observations:
- The trend indicators, momentum indicators, and volume indicators all point towards a bearish sentiment in the stock price.
- The narrowing Bollinger Bands suggest a period of consolidation or decreased volatility.
- The declining OBV and negative CMF indicate weakening buying pressure and lack of significant interest from investors.
Conclusion:
Based on the analysis of the technical indicators, the next few days' possible stock price movement for BEN is likely to be downward. The bearish trend indicated by the moving averages, MACD, RSI, and Stochastic Oscillator, coupled with decreasing buying pressure and lack of significant interest from investors, suggest a continuation of the current downward trajectory. Traders and investors should exercise caution and consider short-term selling strategies or wait for a more favorable entry point before considering long positions.