Technical Analysis of BFAM 2024-05-10
Overview:
In analyzing the technical indicators for BFAM over the last 5 days, we will delve into the trend, momentum, volatility, and volume indicators to provide a comprehensive assessment of the stock's potential price movement. By examining these key factors, we aim to offer valuable insights and predictions for the next few days.
Trend Analysis:
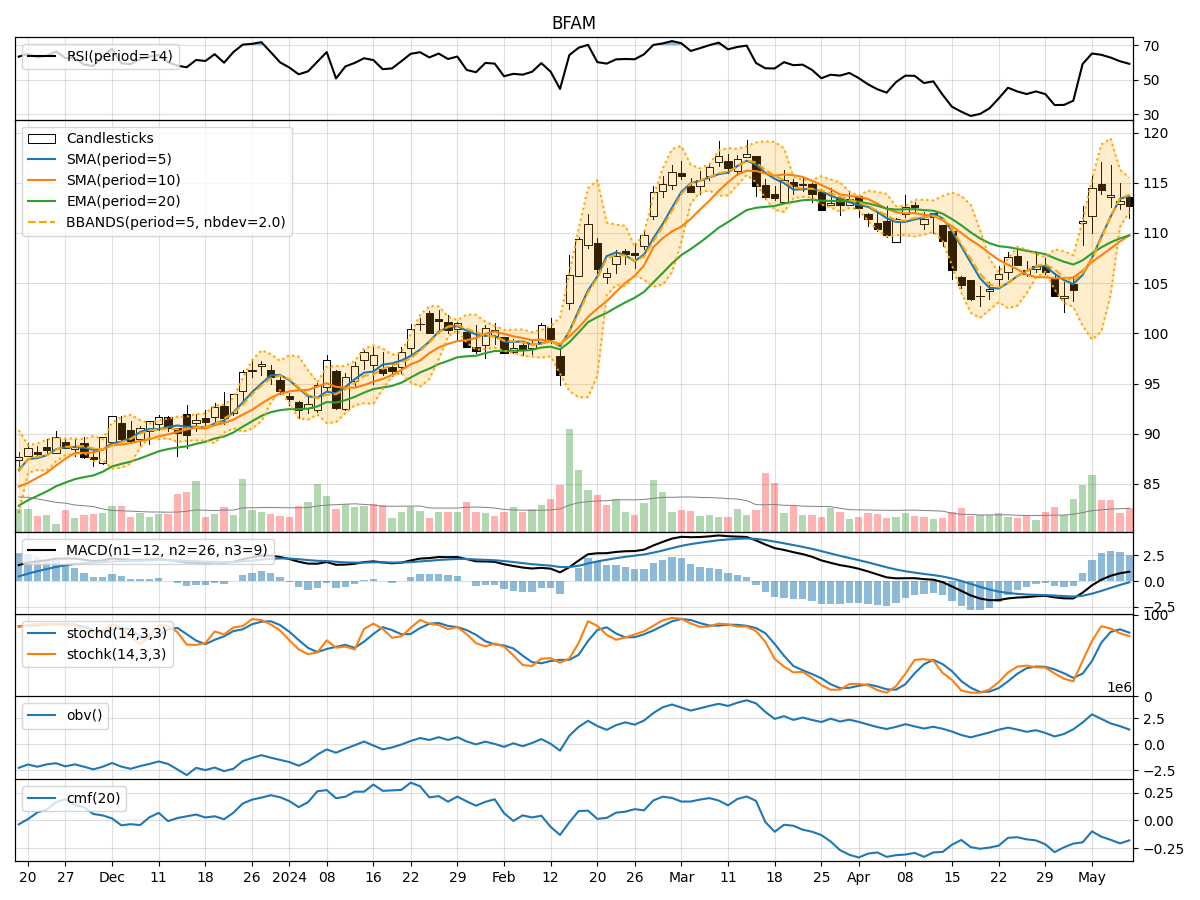
- Moving Averages (MA): The 5-day Moving Average (MA) has been consistently above the Simple Moving Average (SMA) and Exponential Moving Average (EMA), indicating a bullish trend.
- MACD: The MACD line has been above the signal line, with both lines showing an upward trend, suggesting bullish momentum.
Momentum Analysis:
- RSI: The Relative Strength Index (RSI) has been gradually decreasing but remains above 50, indicating a neutral to slightly bearish momentum.
- Stochastic Oscillator: Both %K and %D have been declining, signaling a bearish momentum.
Volatility Analysis:
- Bollinger Bands (BB): The stock price has been trading within the Bollinger Bands, with the bands narrowing, suggesting decreasing volatility.
Volume Analysis:
- On-Balance Volume (OBV): The OBV has been declining, indicating selling pressure in the stock.
- Chaikin Money Flow (CMF): The CMF has been negative, reflecting a bearish sentiment in the stock.
Key Observations:
- The trend indicators suggest a bullish outlook, supported by the moving averages and MACD.
- Momentum indicators show a mixed signal, with RSI neutral and Stochastic Oscillator bearish.
- Volatility has been decreasing, indicating a potential consolidation phase.
- Volume indicators point towards selling pressure and bearish sentiment in the stock.
Conclusion:
Based on the analysis of the technical indicators, the next few days' possible stock price movement for BFAM is likely to be sideways with a slight bearish bias. The bullish trend indicated by moving averages and MACD may face resistance due to the bearish momentum highlighted by RSI and Stochastic Oscillator. The decreasing volatility suggests a consolidation phase, while the negative OBV and CMF signal bearish sentiment. Traders should exercise caution and consider potential short-term downside risk in their trading strategies.