Technical Analysis of BFLY 2024-05-10
Overview:
In analyzing the technical indicators for BFLY over the last 5 days, we will delve into the trend, momentum, volatility, and volume indicators to provide a comprehensive outlook on the possible stock price movement in the coming days. By examining key metrics such as moving averages, MACD, RSI, Bollinger Bands, and OBV, we aim to offer valuable insights and recommendations for potential trading strategies.
Trend Indicators:
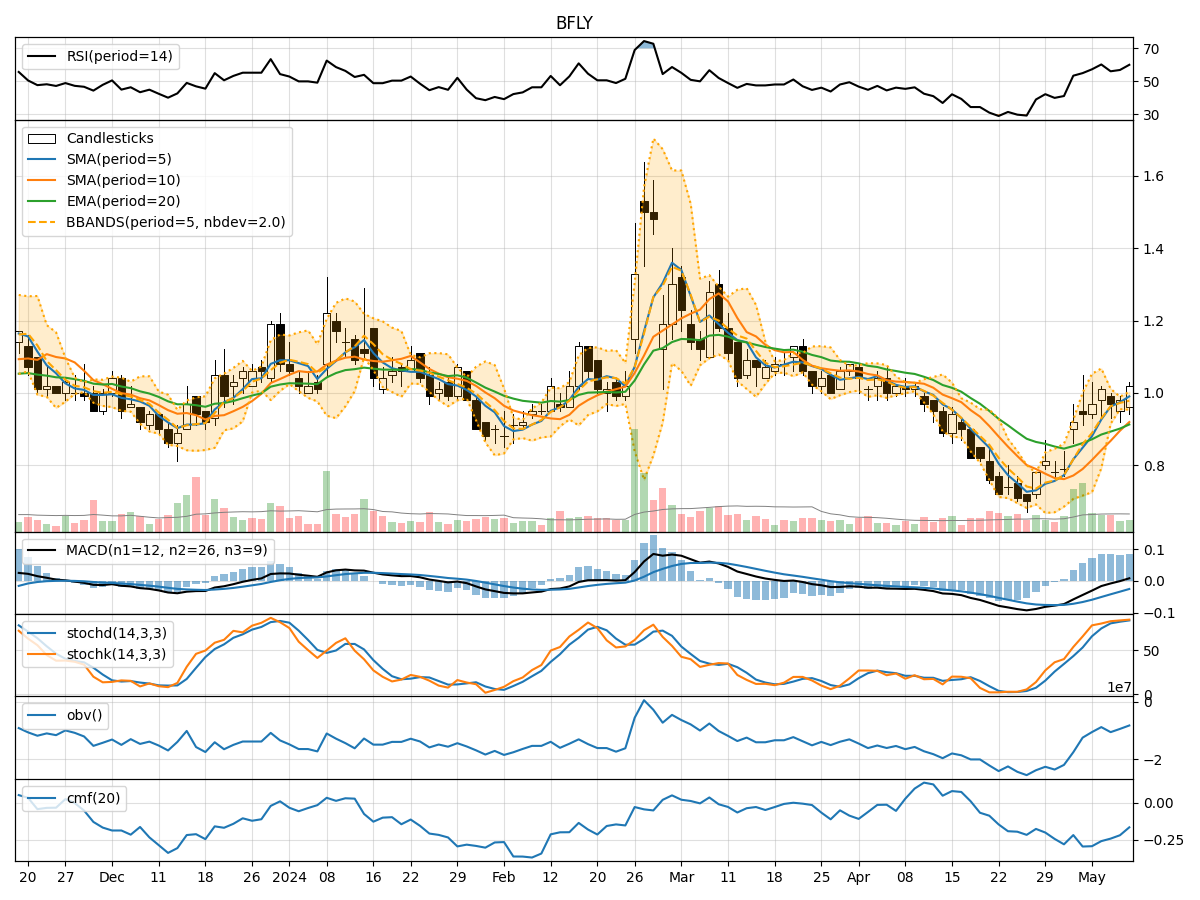
- Moving Averages (MA): The 5-day moving average has been consistently trending upwards, indicating a bullish momentum in the short term.
- MACD: The MACD line has been positive for the past few days, suggesting a bullish trend.
- EMA: The exponential moving average has also been on an upward trajectory, supporting the bullish sentiment.
Momentum Indicators:
- RSI: The Relative Strength Index has been fluctuating around the neutral zone, indicating a lack of strong momentum either way.
- Stochastic Oscillator: Both %K and %D have been in the overbought territory, suggesting a potential reversal or consolidation.
- Williams %R: The Williams %R is hovering near oversold levels, signaling a possible buying opportunity.
Volatility Indicators:
- Bollinger Bands: The stock price has been trading within the Bollinger Bands, indicating a period of consolidation.
- Bollinger Band Width: The narrowing of the Bollinger Bands suggests decreasing volatility and a potential breakout in the near future.
Volume Indicators:
- On-Balance Volume (OBV): The OBV has been relatively flat, indicating a balance between buying and selling pressure.
- Chaikin Money Flow (CMF): The CMF has been negative, suggesting a net outflow of money from the stock.
Key Observations:
- The trend indicators point towards a bullish sentiment in the short term.
- Momentum indicators show mixed signals, with RSI indicating neutrality and Stochastic Oscillator hinting at a potential reversal.
- Volatility indicators suggest a period of consolidation with a potential breakout.
- Volume indicators reflect a balanced market sentiment with a slight negative bias.
Conclusion:
Based on the analysis of the technical indicators, the next few days for BFLY could see sideways consolidation with a slight bullish bias. Traders may consider waiting for a clear breakout above the upper Bollinger Band or a confirmation from the Stochastic Oscillator before making any significant trading decisions. It is essential to monitor the price action closely and consider additional fundamental factors before entering any positions.