Technical Analysis of BHC 2024-05-10
Overview:
In analyzing the technical indicators for BHC over the last 5 days, we will delve into the trend, momentum, volatility, and volume indicators to provide a comprehensive outlook on the possible stock price movement. By examining these key aspects, we aim to offer valuable insights and recommendations for potential future price action.
Trend Analysis:
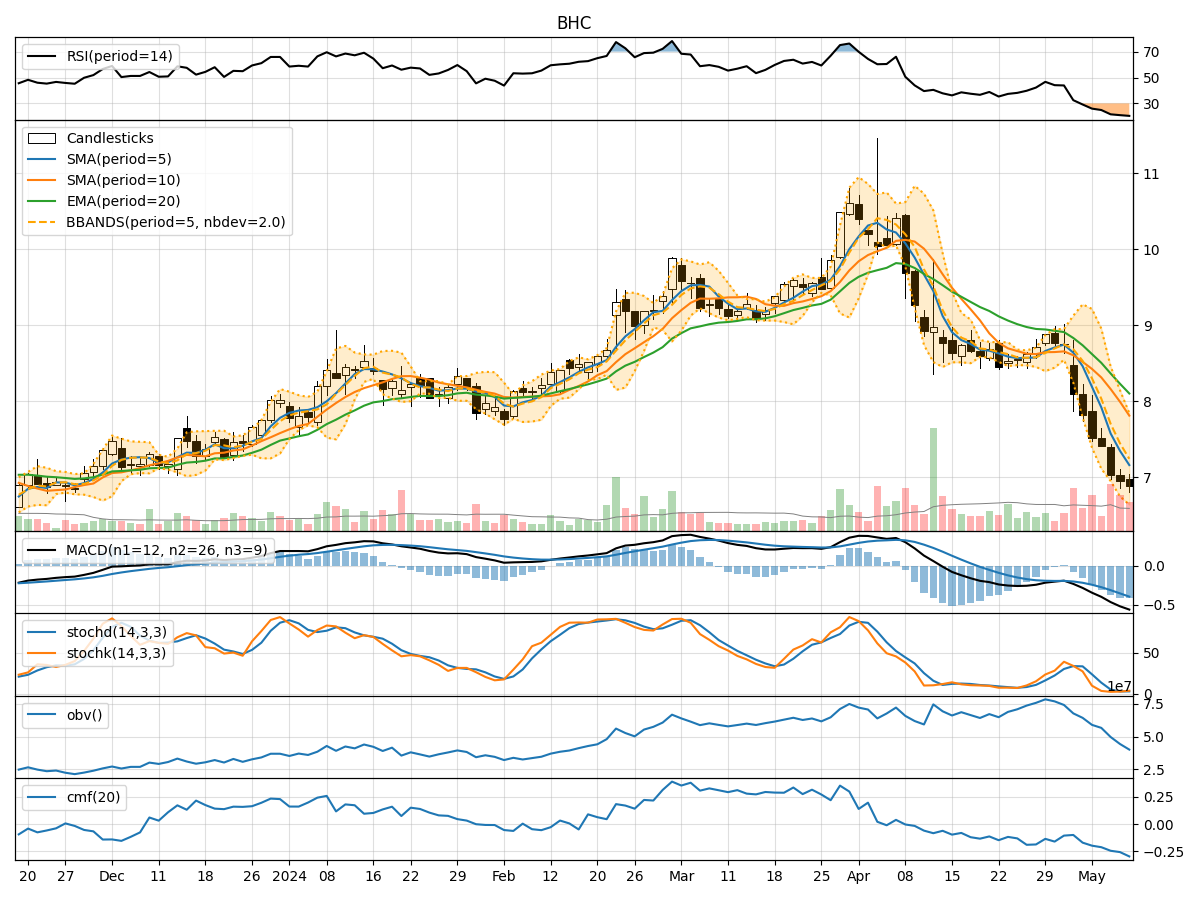
- Moving Averages (MA): The 5-day MA has been consistently below the closing prices, indicating a downward trend.
- MACD: The MACD line has been below the signal line, suggesting bearish momentum.
Key Observation: The trend indicators point towards a downward trajectory for BHC.
Momentum Analysis:
- RSI: The RSI values have been relatively low, indicating oversold conditions.
- Stochastic Oscillator: Both %K and %D values are at extremely low levels, signaling potential oversold conditions.
Key Observation: Momentum indicators suggest that the stock is currently oversold.
Volatility Analysis:
- Bollinger Bands (BB): The stock price has consistently traded below the lower Bollinger Band, indicating increased volatility and potential oversold conditions.
Key Observation: Volatility indicators suggest heightened bearish sentiment.
Volume Analysis:
- On-Balance Volume (OBV): The OBV has been decreasing, reflecting selling pressure.
- Chaikin Money Flow (CMF): The CMF values are negative, indicating a lack of buying interest.
Key Observation: Volume indicators point towards bearish sentiment in the market.
Conclusion:
Based on the analysis of trend, momentum, volatility, and volume indicators, the overall outlook for BHC in the next few days appears to be bearish. The stock is currently in a downtrend with oversold momentum and heightened volatility. Additionally, the volume indicators suggest a lack of buying interest and increasing selling pressure.
Recommendation:
Considering the bearish signals across multiple technical indicators, it is advisable to exercise caution when considering any long positions on BHC in the near term. Traders may look for potential shorting opportunities or wait for signs of a reversal before considering any bullish positions. It is essential to closely monitor the price action and key technical levels to make informed trading decisions.
By incorporating a comprehensive analysis of the technical indicators and market dynamics, investors can better navigate the current market conditions and position themselves strategically for potential price movements.