Technical Analysis of BHE 2024-05-10
Overview:
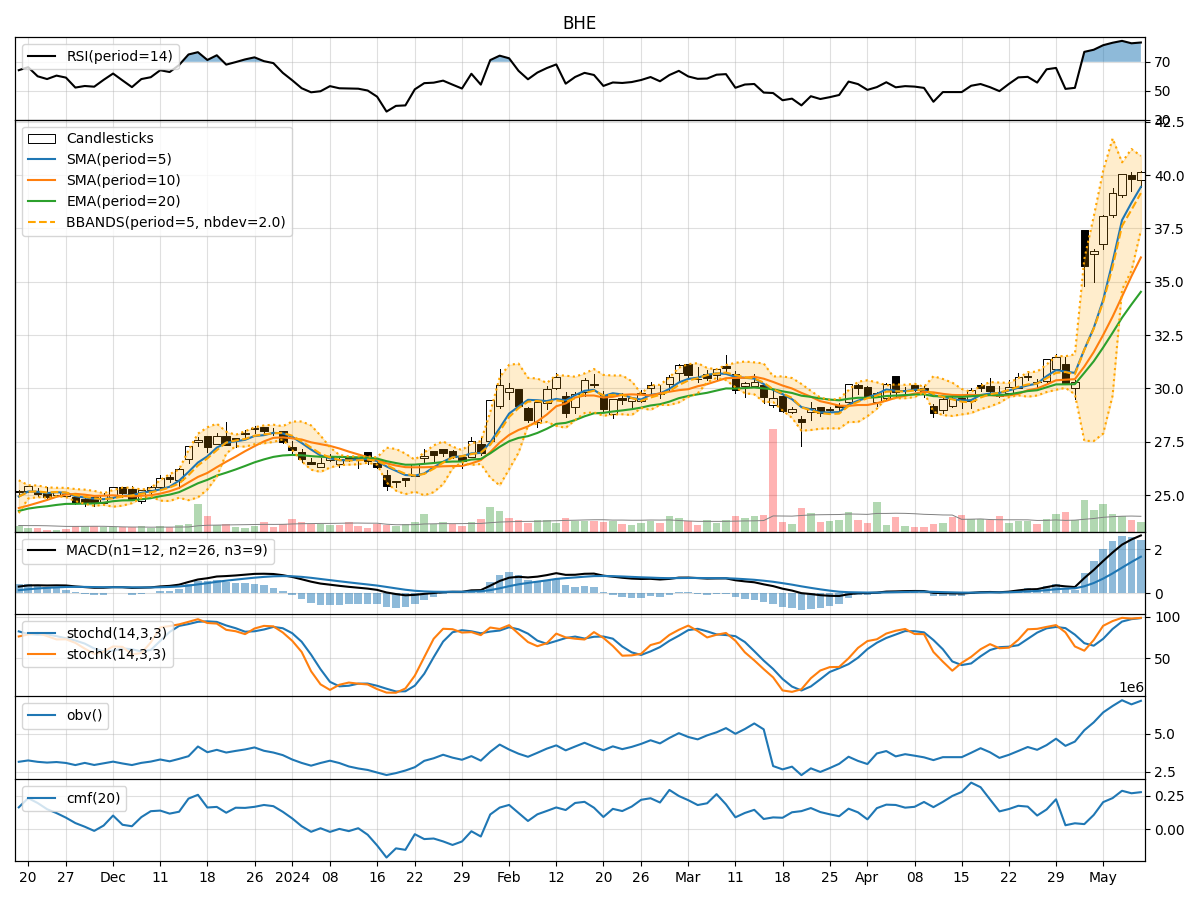
In the last 5 trading days, BHE stock has shown a consistent uptrend in both price and volume. The moving averages have been steadily increasing, indicating a bullish trend. Momentum indicators like RSI and Stochastic oscillators are in overbought territory, suggesting a potential pullback. Volatility indicators show expanding Bollinger Bands, indicating increased price volatility. Volume indicators like OBV and CMF are positive, supporting the uptrend.
Trend Indicators Analysis:
- Moving averages (MA) are trending upwards, with the 5-day MA consistently above the longer-term SMAs and EMAs.
- MACD is positive and increasing, indicating bullish momentum.
- The MACD histogram is also rising, showing strengthening bullish momentum.
Momentum Indicators Analysis:
- RSI is in overbought territory, suggesting a potential reversal or consolidation.
- Stochastic oscillators are in the overbought zone, indicating a possible pullback.
- Williams %R is also in the oversold region, signaling a potential reversal.
Volatility Indicators Analysis:
- Bollinger Bands are widening, indicating increased price volatility.
- The upper Bollinger Band is expanding faster than the lower band, suggesting a potential continuation of the uptrend.
- Bollinger Band %B is above 0.5, indicating an uptrend.
Volume Indicators Analysis:
- On-Balance Volume (OBV) is increasing, showing accumulation by investors.
- Chaikin Money Flow (CMF) is positive, indicating buying pressure.
Key Observations:
- The stock is in a strong uptrend based on moving averages and MACD.
- Momentum indicators suggest a potential pullback or consolidation due to overbought conditions.
- Volatility is increasing, which could lead to larger price swings.
- Volume indicators support the uptrend, indicating strong buying interest.
Conclusion:
Based on the technical analysis of trend, momentum, volatility, and volume indicators, the next few days for BHE stock are likely to see a pullback or consolidation. The stock has been on a strong uptrend, but with momentum indicators in overbought territory, a temporary reversal or sideways movement is probable. Traders should be cautious of a potential correction in the short term. Long-term investors can use any pullback as a buying opportunity to participate in the overall bullish trend.