Technical Analysis of BHIL 2024-05-31
Overview:
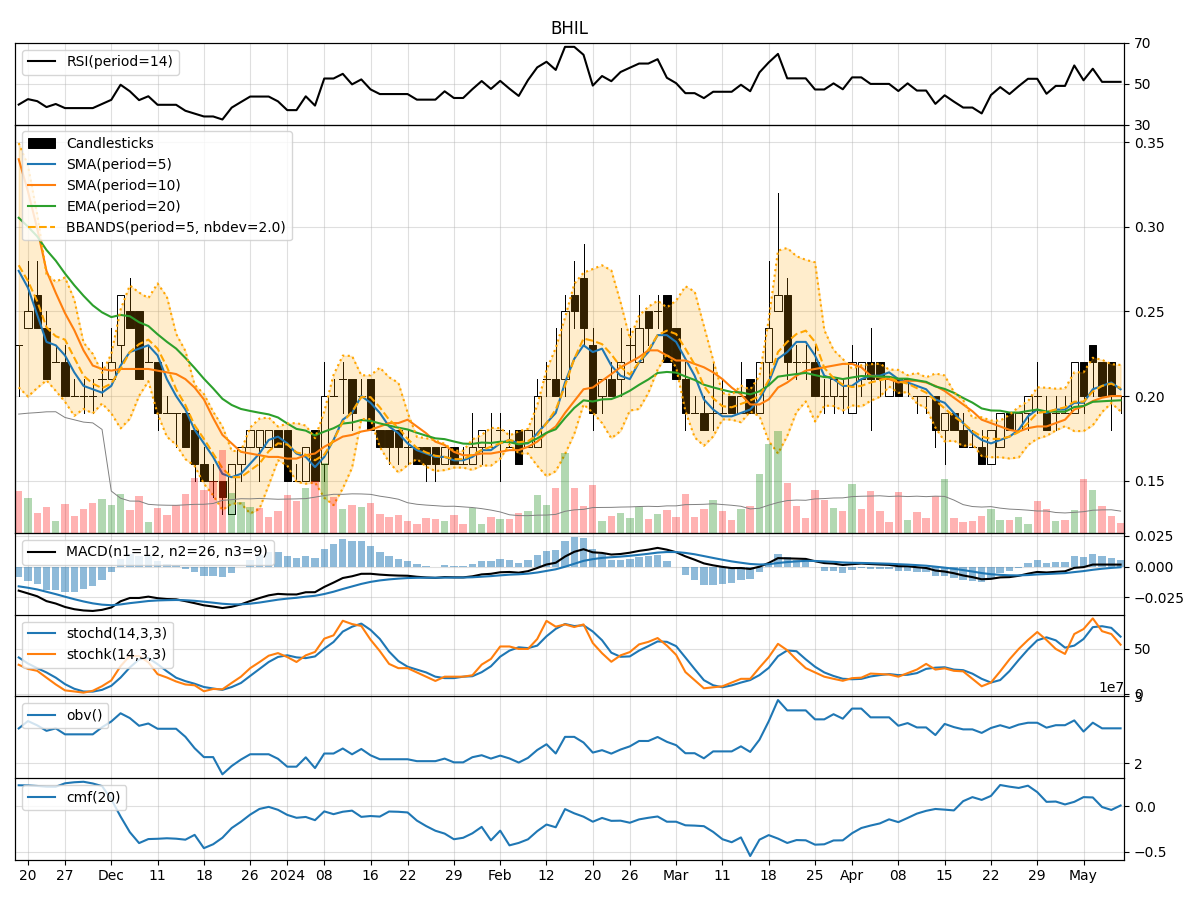
In analyzing the technical indicators for BHIL stock over the last 5 days, we will delve into the trend, momentum, volatility, and volume indicators to provide a comprehensive outlook on the possible stock price movement in the coming days. By examining these key aspects, we aim to offer valuable insights and predictions to guide your investment decisions.
Trend Analysis:
- Moving Averages (MA): The 5-day MA has been consistently decreasing, indicating a downward trend in the stock price.
- MACD: The MACD line has been negative, suggesting bearish momentum in the stock.
- EMA: The EMA has also been declining, reinforcing the bearish sentiment in the stock.
Momentum Analysis:
- RSI: The RSI has been fluctuating around the 50 level, indicating indecision in the market.
- Stochastic Oscillator: Both %K and %D have been decreasing, signaling a potential oversold condition.
- Williams %R: The Williams %R has been in the oversold territory, suggesting a possible reversal in the stock price.
Volatility Analysis:
- Bollinger Bands: The stock price has been trading below the lower Bollinger Band, indicating oversold conditions.
- Bollinger %B: The %B indicator has been below 0.2, suggesting a potential bounce back in the stock price.
Volume Analysis:
- On-Balance Volume (OBV): The OBV has been fluctuating, indicating mixed buying and selling pressure.
- Chaikin Money Flow (CMF): The CMF has been positive, suggesting some buying interest in the stock.
Key Observations:
- The stock is currently in a downtrend based on the moving averages and MACD.
- Momentum indicators show signs of oversold conditions and a possible reversal.
- Volatility indicators suggest the stock may be oversold and due for a bounce back.
- Volume indicators reflect mixed sentiment with some buying interest.
Conclusion:
Based on the analysis of the technical indicators, the next few days may see a potential reversal in the stock price. The oversold conditions indicated by momentum and volatility indicators, coupled with the mixed volume signals, suggest a possible upward movement in the stock price. Traders and investors could consider buying opportunities in anticipation of a bounce back in the stock price. However, it is essential to monitor the indicators closely for confirmation of the reversal and set appropriate stop-loss levels to manage risk effectively.