Technical Analysis of BILL 2024-05-10
Overview:
In analyzing the technical indicators for BILL over the last 5 days, we will delve into the trend, momentum, volatility, and volume indicators to provide a comprehensive outlook on the possible stock price movement in the coming days.
Trend Analysis:
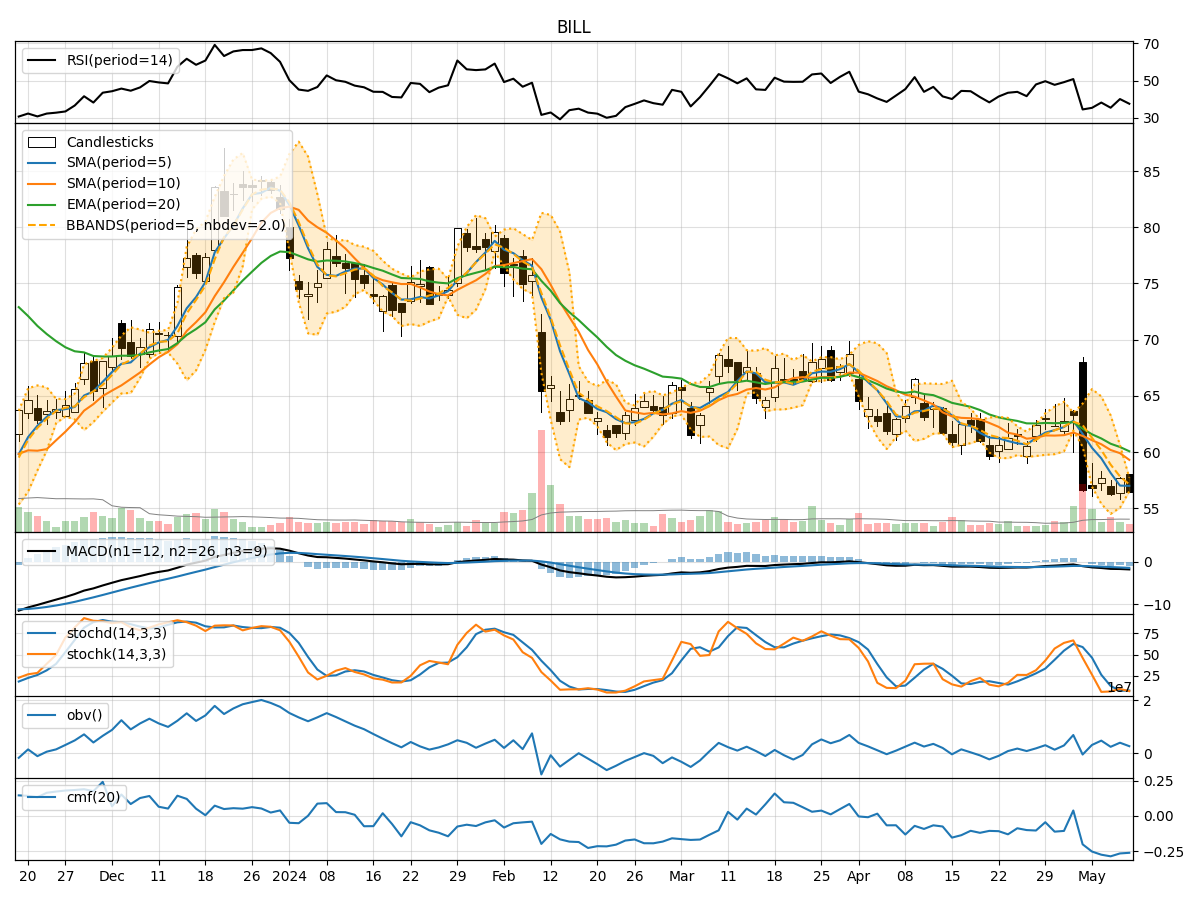
- Moving Averages (MA): The 5-day Moving Average (MA) has been consistently below the Simple Moving Average (SMA) and Exponential Moving Average (EMA) over the past 5 days, indicating a downward trend.
- MACD: The Moving Average Convergence Divergence (MACD) has been negative, with the MACD line consistently below the Signal line, suggesting bearish momentum.
Momentum Analysis:
- RSI: The Relative Strength Index (RSI) has been below 50, indicating bearish momentum in the stock.
- Stochastic Oscillator: Both %K and %D have been in the oversold territory, signaling a potential reversal or continuation of the downtrend.
Volatility Analysis:
- Bollinger Bands (BB): The stock price has been trading below the lower Bollinger Band, indicating oversold conditions and potential for a reversal.
Volume Analysis:
- On-Balance Volume (OBV): The OBV has been declining, suggesting that selling pressure has been dominant in the stock.
- Chaikin Money Flow (CMF): The CMF has been negative, indicating outflow of money from the stock.
Key Observations:
- The stock is currently in a downtrend based on moving averages and MACD.
- Momentum indicators like RSI and Stochastic Oscillator suggest bearish sentiment.
- Volatility indicators show the stock is oversold according to Bollinger Bands.
- Volume indicators reflect selling pressure as seen in OBV and CMF.
Conclusion:
Based on the analysis of the technical indicators, the next few days' possible stock price movement for BILL is likely to be downward. The stock is currently in a bearish phase, with indicators pointing towards further downside potential. Traders and investors should exercise caution and consider waiting for signs of a reversal before considering long positions.