Technical Analysis of BIO 2024-05-10
Overview:
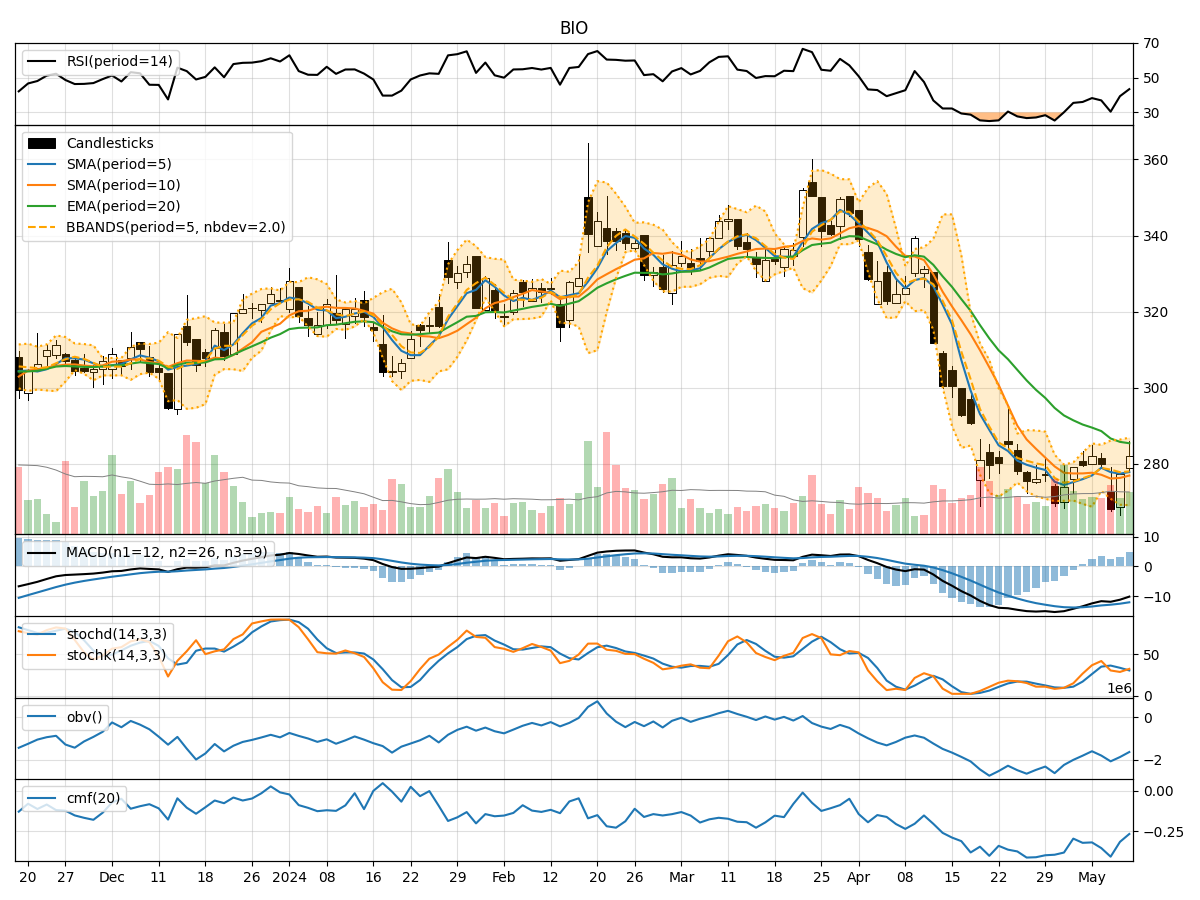
In analyzing the technical indicators for BIO stock over the last 5 days, we will delve into the trend, momentum, volatility, and volume indicators to provide a comprehensive outlook on the possible stock price movement in the coming days. By examining these key indicators, we aim to offer valuable insights and predictions for potential investors.
Trend Analysis:
- Moving Averages (MA): The 5-day Moving Average (MA) has been fluctuating around the closing prices, indicating short-term price trends. The Simple Moving Average (SMA) and Exponential Moving Average (EMA) show a downward trend, suggesting a bearish sentiment in the market.
- MACD: The Moving Average Convergence Divergence (MACD) and its signal line are negative, indicating a bearish trend in the stock price.
- Conclusion: The trend indicators suggest a bearish outlook for the stock in the near term.
Momentum Analysis:
- RSI: The Relative Strength Index (RSI) is below 50, indicating bearish momentum in the stock.
- Stochastic Oscillator: Both %K and %D are below 50, signaling a bearish momentum.
- Williams %R: The Williams %R is in the oversold territory, suggesting a potential reversal or continuation of the downtrend.
- Conclusion: The momentum indicators align with the trend indicators, supporting a bearish momentum in the stock.
Volatility Analysis:
- Bollinger Bands (BB): The stock price has been trading within the lower Bollinger Band, indicating a potential oversold condition.
- Bollinger Band Width: The Band Width is expanding, suggesting increased volatility in the stock price.
- Conclusion: The volatility indicators imply a high volatility environment, which could lead to sharp price movements in either direction.
Volume Analysis:
- On-Balance Volume (OBV): The OBV has been declining, indicating selling pressure in the stock.
- Chaikin Money Flow (CMF): The CMF is negative, suggesting outflow of money from the stock.
- Conclusion: The volume indicators support the bearish sentiment, indicating higher selling volume in the stock.
Conclusion:
Based on the analysis of trend, momentum, volatility, and volume indicators, the overall outlook for BIO stock is bearish. The stock is likely to experience further downward movement in the coming days, driven by the negative trend and momentum signals, high volatility, and increased selling volume. Investors should exercise caution and consider waiting for a more favorable entry point before considering any long positions. Downward price movement is anticipated in the near term.
Disclaimer:
This analysis is based solely on technical indicators and historical data, and it is important to consider other fundamental factors and market dynamics before making any investment decisions. It is recommended to consult with a financial advisor or conduct further research to gain a holistic view of the stock's potential performance.