Technical Analysis of BIP 2024-05-10
Overview:
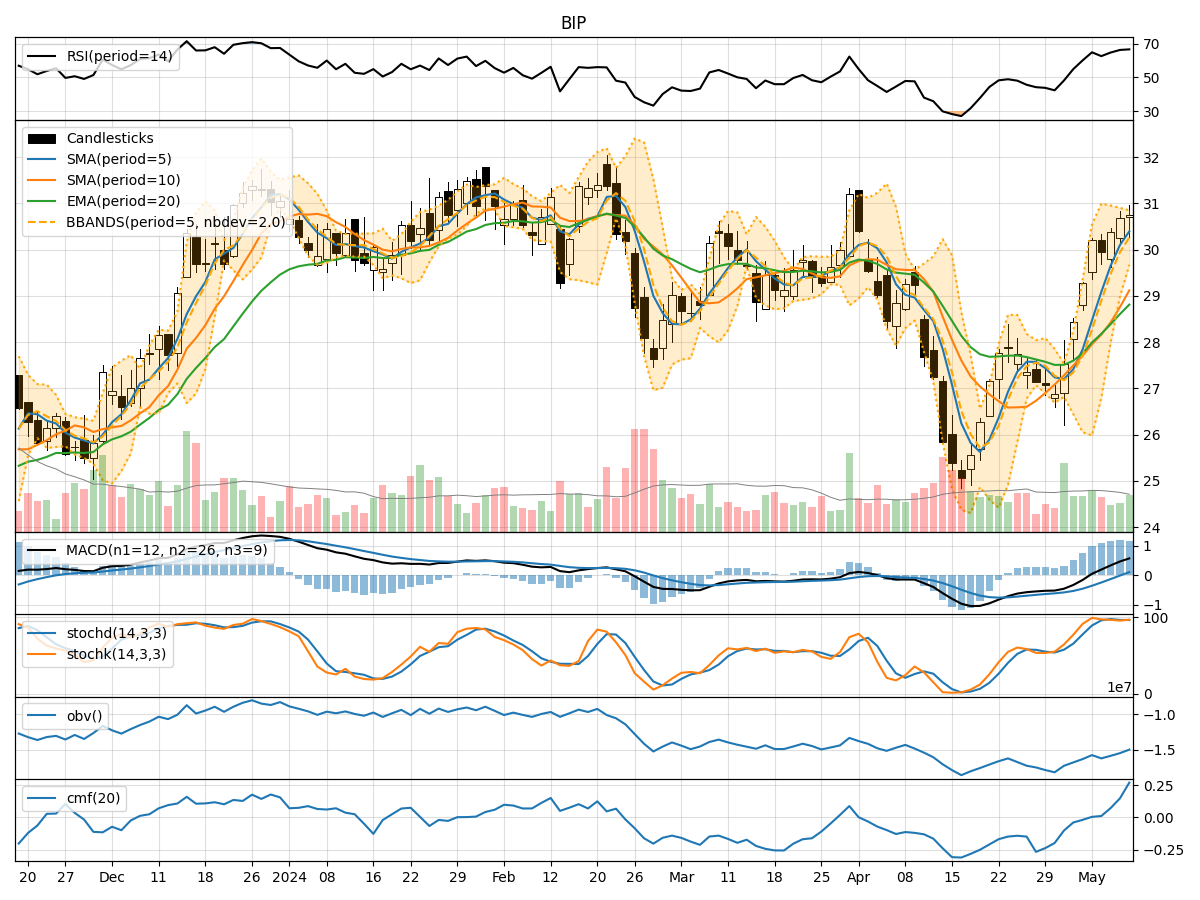
In analyzing the technical indicators for BIP over the last 5 days, we will delve into the trends, momentum, volatility, and volume aspects to provide a comprehensive outlook on the possible stock price movement. By examining key indicators such as moving averages, MACD, RSI, Bollinger Bands, and OBV, we aim to offer valuable insights and predictions for the upcoming days.
Trend Analysis:
- Moving Averages (MA): The 5-day MA has been consistently rising, indicating a bullish trend in the short term.
- MACD: The MACD line has been above the signal line, suggesting positive momentum in the stock price.
Momentum Analysis:
- RSI: The RSI has been in the overbought territory, indicating a potential reversal or consolidation phase.
- Stochastic Oscillator: Both %K and %D have been relatively high, signaling a strong upward momentum.
Volatility Analysis:
- Bollinger Bands (BB): The stock price has been trading near the upper Bollinger Band, suggesting high volatility and a possible overbought condition.
Volume Analysis:
- On-Balance Volume (OBV): The OBV has shown a positive trend, indicating accumulation by investors.
Key Observations:
- The stock is currently in an upward trend based on moving averages and MACD.
- Momentum indicators like RSI and Stochastic Oscillator suggest a potential overbought condition and a need for caution.
- Volatility is high, as indicated by the proximity to the upper Bollinger Band.
- Volume has been increasing, reflecting growing interest from investors.
Conclusion:
Based on the technical analysis of BIP, the stock is likely to experience short-term consolidation or a minor pullback due to the overbought signals from momentum indicators like RSI. However, the overall trend remains bullish supported by moving averages and MACD. Traders should monitor the stock closely for potential entry points during any pullback, while investors may consider holding their positions for further upside potential. It is advisable to set stop-loss levels to manage risk effectively in case of a reversal.