Technical Analysis of BIRK 2024-05-10
Overview:
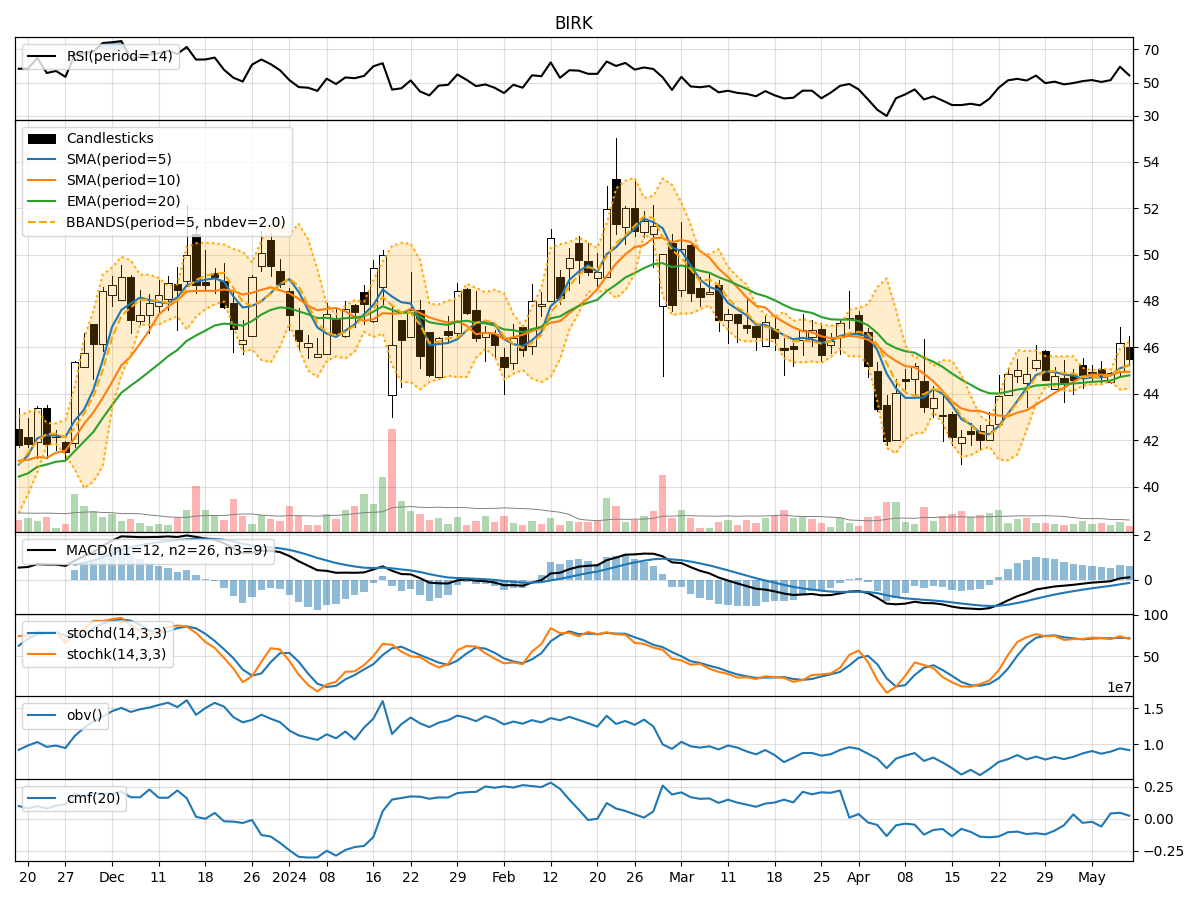
In analyzing the technical indicators for BIRK stock over the last 5 days, we will delve into the trend, momentum, volatility, and volume indicators to provide a comprehensive outlook on the possible stock price movement in the coming days. By examining these key aspects, we aim to offer valuable insights and recommendations for potential investors.
Trend Analysis:
- Moving Averages (MA): The 5-day Moving Average (MA) has been fluctuating around the closing prices, indicating short-term price trends. The Simple Moving Average (SMA) and Exponential Moving Average (EMA) show a slight upward trend, suggesting a potential bullish sentiment.
- Moving Average Convergence Divergence (MACD): The MACD line has been positive, with the MACD Histogram showing an increasing trend, indicating a strengthening bullish momentum.
Momentum Analysis:
- Relative Strength Index (RSI): The RSI has been fluctuating around the mid-level, indicating a neutral sentiment in the market.
- Stochastic Oscillator: Both %K and %D lines of the Stochastic Oscillator have been in the overbought zone, suggesting a potential reversal or consolidation in the near future.
- Williams %R (Willams %R): The Williams %R is in the oversold territory, indicating a possible buying opportunity.
Volatility Analysis:
- Bollinger Bands (BB): The Bollinger Bands have widened, indicating increased volatility in the stock price. The current price is hovering around the upper band, suggesting a potential overbought condition.
- Bollinger %B (BB %B): The %B indicator is below 1, indicating a potential reversal or correction in the stock price.
Volume Analysis:
- On-Balance Volume (OBV): The OBV has been fluctuating, suggesting indecision among market participants.
- Chaikin Money Flow (CMF): The CMF has been positive, indicating a potential inflow of money into the stock.
Conclusion:
Based on the analysis of the technical indicators, the stock of BIRK is showing mixed signals. While the trend indicators suggest a bullish sentiment with the moving averages and MACD pointing towards a potential uptrend, the momentum indicators indicate a possible reversal with the Stochastic Oscillator in the overbought zone and Williams %R in the oversold territory.
The volatility indicators suggest increased volatility in the stock price, which could lead to sharp movements in either direction. The volume indicators show indecisiveness among investors, reflecting a lack of clear direction.
In conclusion, considering the mixed signals from the technical indicators, it is advisable for investors to exercise caution and closely monitor the price action in the coming days. A wait-and-see approach may be prudent until a clearer trend emerges in the stock of BIRK.