Technical Analysis of BKD 2024-05-10
Overview:
In analyzing the technical indicators for BKD over the last 5 days, we will delve into the trend, momentum, volatility, and volume indicators to provide a comprehensive outlook on the possible stock price movement in the coming days. By examining these key indicators, we aim to offer valuable insights and predictions for potential investors.
Trend Analysis:
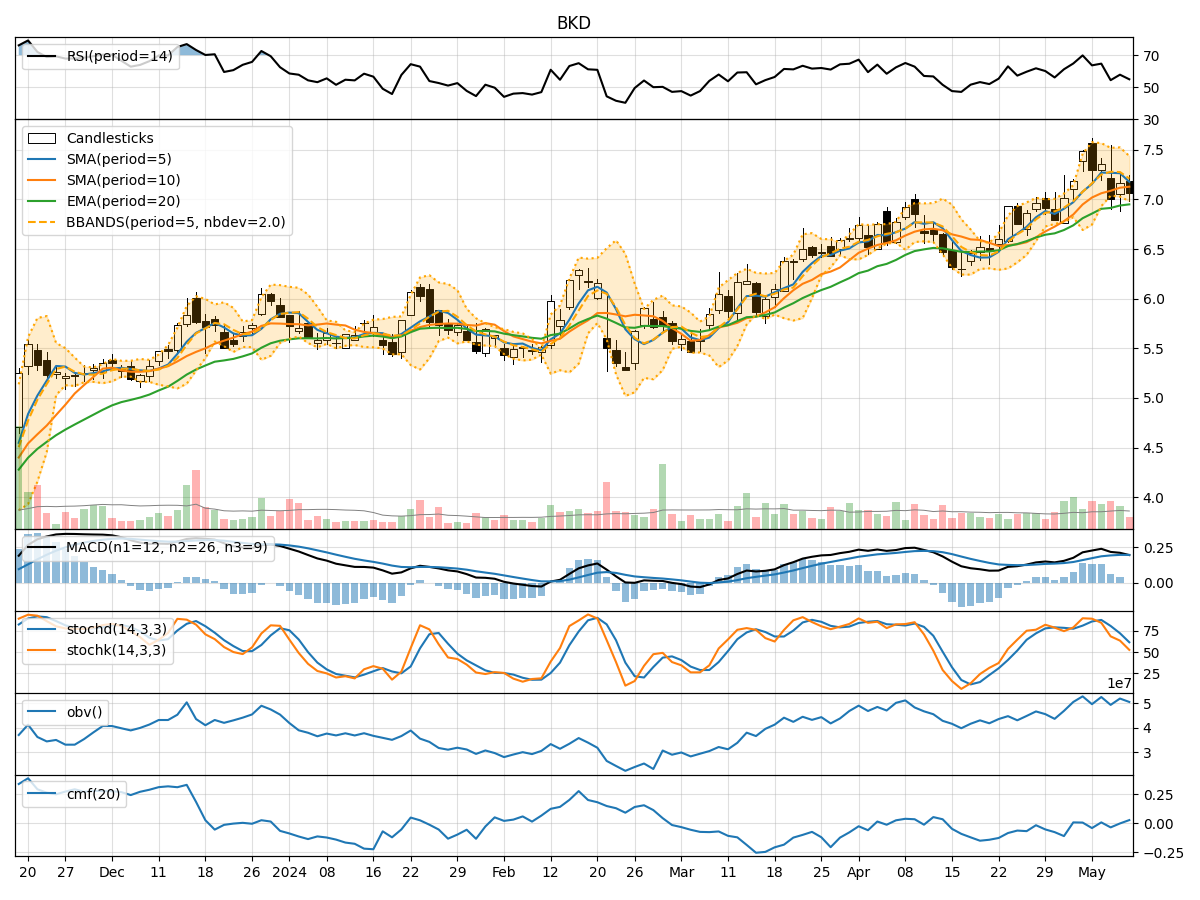
- Moving Averages (MA): The 5-day Moving Average (MA) has been fluctuating around the stock price, indicating short-term price trends. The Simple Moving Average (SMA) and Exponential Moving Average (EMA) have been gradually increasing, suggesting a positive trend.
- MACD: The Moving Average Convergence Divergence (MACD) has shown positive values, with the MACD line consistently above the signal line. This indicates bullish momentum in the stock price.
Momentum Analysis:
- RSI: The Relative Strength Index (RSI) has been hovering around the mid-level, indicating neutral momentum in the stock.
- Stochastic Oscillator: Both %K and %D values have been declining, suggesting a potential reversal in momentum to the downside.
- Williams %R: The Williams %R indicator has been in the oversold territory, indicating a possible buying opportunity.
Volatility Analysis:
- Bollinger Bands (BB): The Bollinger Bands have been narrowing, indicating decreasing volatility in the stock price.
- Bollinger %B: The %B indicator has been fluctuating around the mid-level, suggesting a balanced market sentiment.
Volume Analysis:
- On-Balance Volume (OBV): The OBV indicator has shown mixed signals, with fluctuations in volume accumulation.
- Chaikin Money Flow (CMF): The CMF has been negative, indicating selling pressure in the stock.
Key Observations:
- The trend indicators suggest a positive outlook with increasing moving averages and bullish MACD signals.
- Momentum indicators show a neutral to slightly bearish sentiment, with the Stochastic Oscillator signaling a potential reversal.
- Volatility has been decreasing, indicating a possible period of consolidation.
- Volume indicators reflect mixed signals, with OBV showing fluctuations and CMF indicating selling pressure.
Conclusion:
Based on the analysis of the technical indicators, the stock price of BKD is likely to experience sideways movement in the coming days. While the trend indicators point towards a bullish outlook, the momentum indicators suggest a neutral to slightly bearish sentiment. The decreasing volatility and mixed volume signals further support the expectation of sideways movement. Investors should closely monitor key support and resistance levels for potential entry or exit points.