Technical Analysis of BLD 2024-05-10
Overview:
In analyzing the technical indicators for BLD over the last 5 days, we will delve into the trend, momentum, volatility, and volume indicators to provide a comprehensive outlook on the possible stock price movement in the coming days. By examining these key aspects, we aim to offer valuable insights and predictions for potential investors.
Trend Analysis:
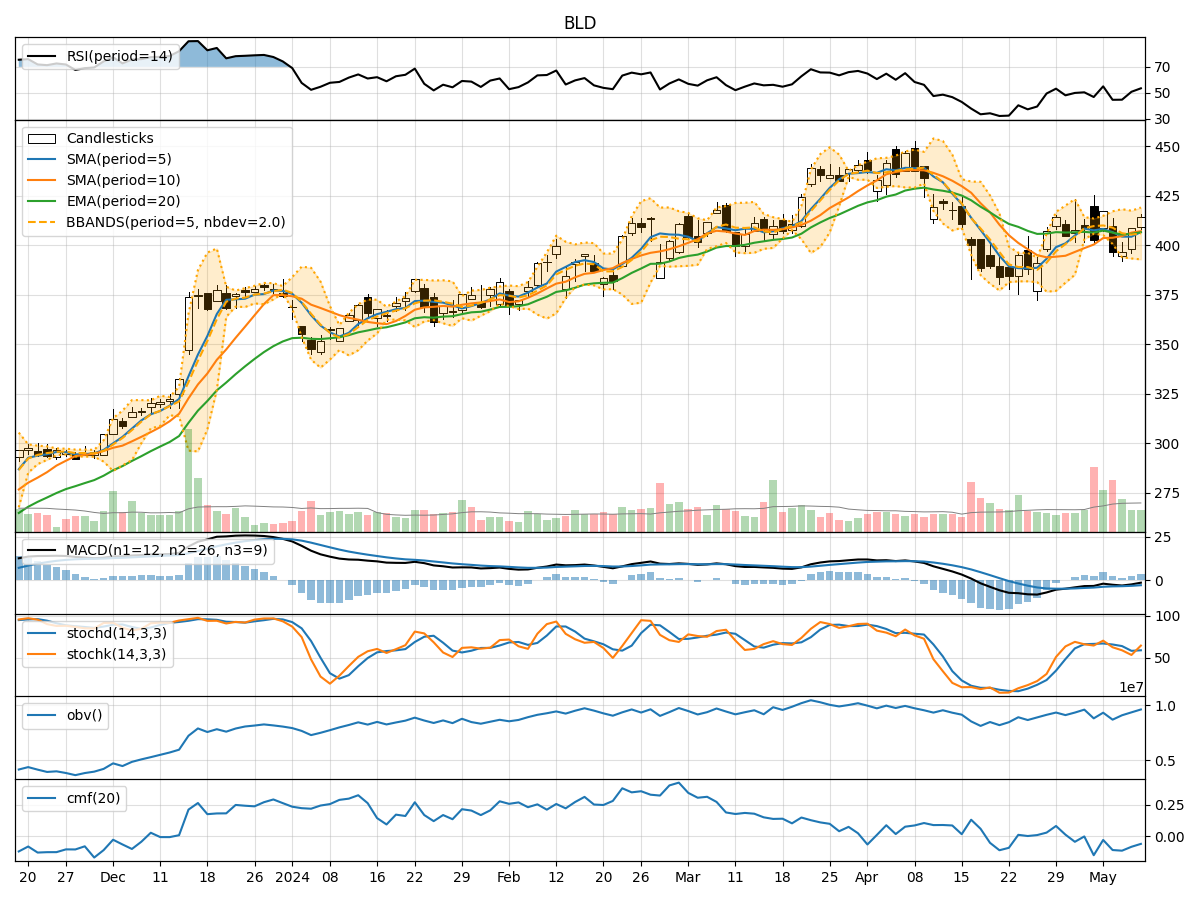
- Moving Averages (MA): The 5-day Moving Average (MA) has been fluctuating around the Simple Moving Average (SMA) and Exponential Moving Average (EMA) values, indicating a lack of clear trend direction.
- MACD: The MACD line has been negative, with the MACD Histogram showing a slight improvement but still in negative territory, suggesting a bearish momentum.
Momentum Analysis:
- RSI: The Relative Strength Index (RSI) has been hovering around the mid-level, indicating a neutral momentum.
- Stochastic Oscillator: Both %K and %D values have been fluctuating, showing indecision in momentum.
- Williams %R: The Williams %R is also fluctuating but has not reached extreme overbought or oversold levels.
Volatility Analysis:
- Bollinger Bands (BB): The Bollinger Bands have been widening, indicating increased volatility in the stock price.
- Bollinger %B: The %B value has been fluctuating within the bands, suggesting no clear trend in volatility.
Volume Analysis:
- On-Balance Volume (OBV): The OBV has shown mixed signals, with some days seeing positive volume accumulation and others showing distribution.
- Chaikin Money Flow (CMF): The CMF has been negative, indicating selling pressure in the stock.
Key Observations:
- The stock has been experiencing mixed signals across different technical indicators, with no clear trend direction.
- Volatility has been increasing, as seen in the widening Bollinger Bands, which could lead to larger price swings.
- Momentum indicators are showing indecision, with RSI, Stochastic Oscillator, and Williams %R not providing a clear signal.
Conclusion:
Based on the analysis of the technical indicators, the stock of BLD is currently consolidating with no clear trend in place. The volatility is increasing, which could lead to larger price swings in the coming days. The momentum is neutral, indicating a lack of strong buying or selling pressure. Therefore, it is recommended to exercise caution and wait for clearer signals before making any significant trading decisions.