Technical Analysis of BLX 2024-05-10
Overview:
In analyzing the technical indicators for BLX over the last 5 days, we will delve into the trend, momentum, volatility, and volume indicators to provide a comprehensive outlook on the possible stock price movement in the coming days. By examining these key aspects, we aim to offer valuable insights and predictions to guide investment decisions.
Trend Analysis:
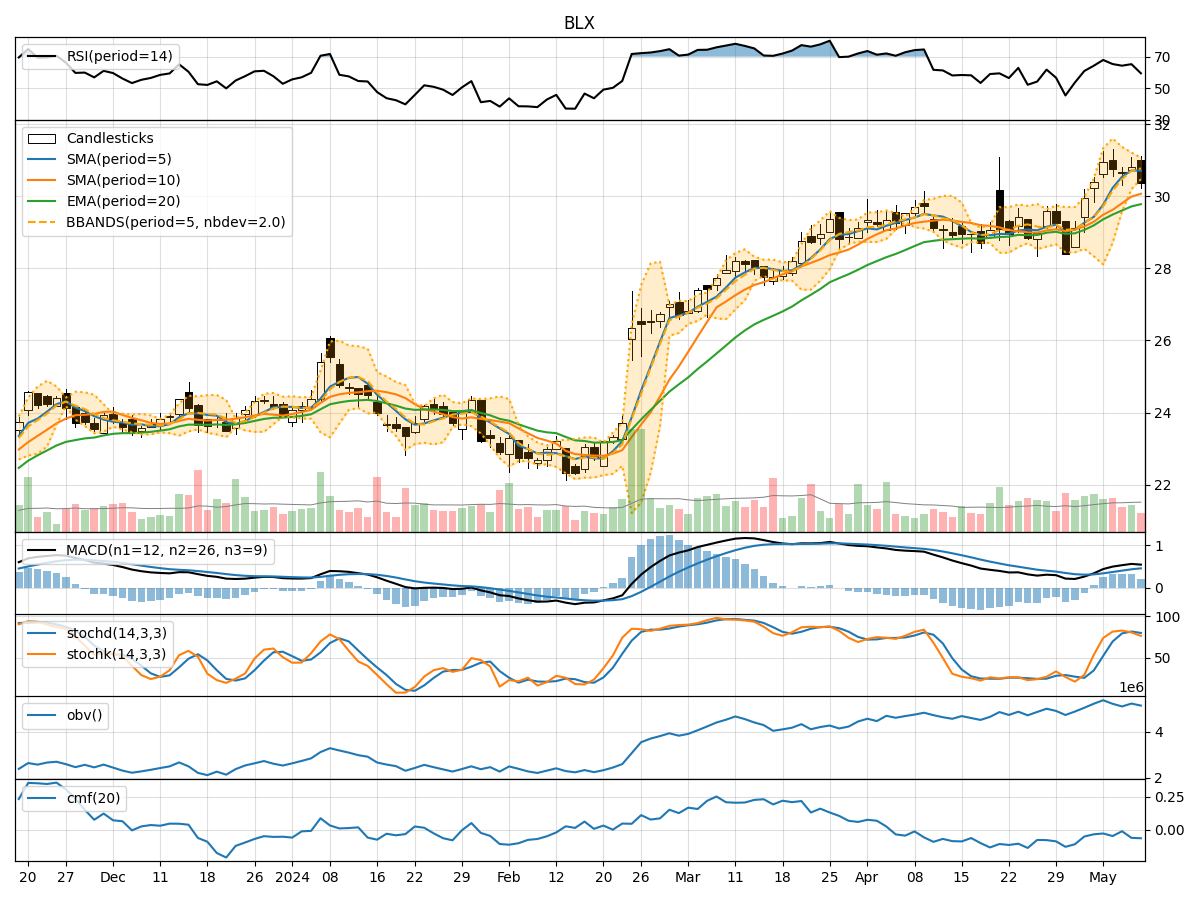
- Moving Averages (MA): The 5-day Moving Average (MA) has been consistently above the Simple Moving Average (SMA) and Exponential Moving Average (EMA), indicating a bullish trend.
- MACD: The MACD line has been above the signal line, with both lines showing an upward trend, suggesting positive momentum in the stock price.
Momentum Analysis:
- RSI: The Relative Strength Index (RSI) has been fluctuating but generally staying above 50, indicating bullish momentum.
- Stochastic Oscillator: Both %K and %D have been in the overbought zone, suggesting a potential reversal or consolidation.
Volatility Analysis:
- Bollinger Bands (BB): The stock price has mostly stayed within the Bollinger Bands, with the bands narrowing, indicating decreasing volatility.
Volume Analysis:
- On-Balance Volume (OBV): The OBV has been fluctuating but generally showing a slight decrease, indicating some distribution.
- Chaikin Money Flow (CMF): The CMF has been negative, suggesting selling pressure in the stock.
Key Observations:
- The trend indicators suggest a bullish sentiment in the stock price.
- Momentum indicators show mixed signals with potential for a reversal.
- Volatility has been decreasing, indicating a possible period of consolidation.
- Volume indicators point towards some distribution and selling pressure.
Conclusion:
Based on the analysis of the technical indicators, the next few days' possible stock price movement for BLX is likely to be sideways with a slight bearish bias. While the trend remains bullish, the mixed signals from momentum indicators and selling pressure indicated by volume indicators suggest a potential consolidation phase or a minor pullback in the stock price. Traders may consider monitoring key support and resistance levels for potential entry or exit points.
Recommendation:
- Short-term Traders: Consider taking profits or tightening stop-loss levels to manage risk during the consolidation phase.
- Long-term Investors: Monitor the price action for potential buying opportunities at key support levels.
By staying vigilant and adapting to the evolving market conditions, investors can make informed decisions to navigate the upcoming price movements in BLX effectively.