Technical Analysis of BMO 2024-05-10
Overview:
In analyzing the technical indicators for BMO over the last 5 days, we will delve into the trend, momentum, volatility, and volume indicators to provide a comprehensive outlook on the possible stock price movement. By examining these key aspects, we aim to offer valuable insights and predictions for the upcoming days.
Trend Indicators:
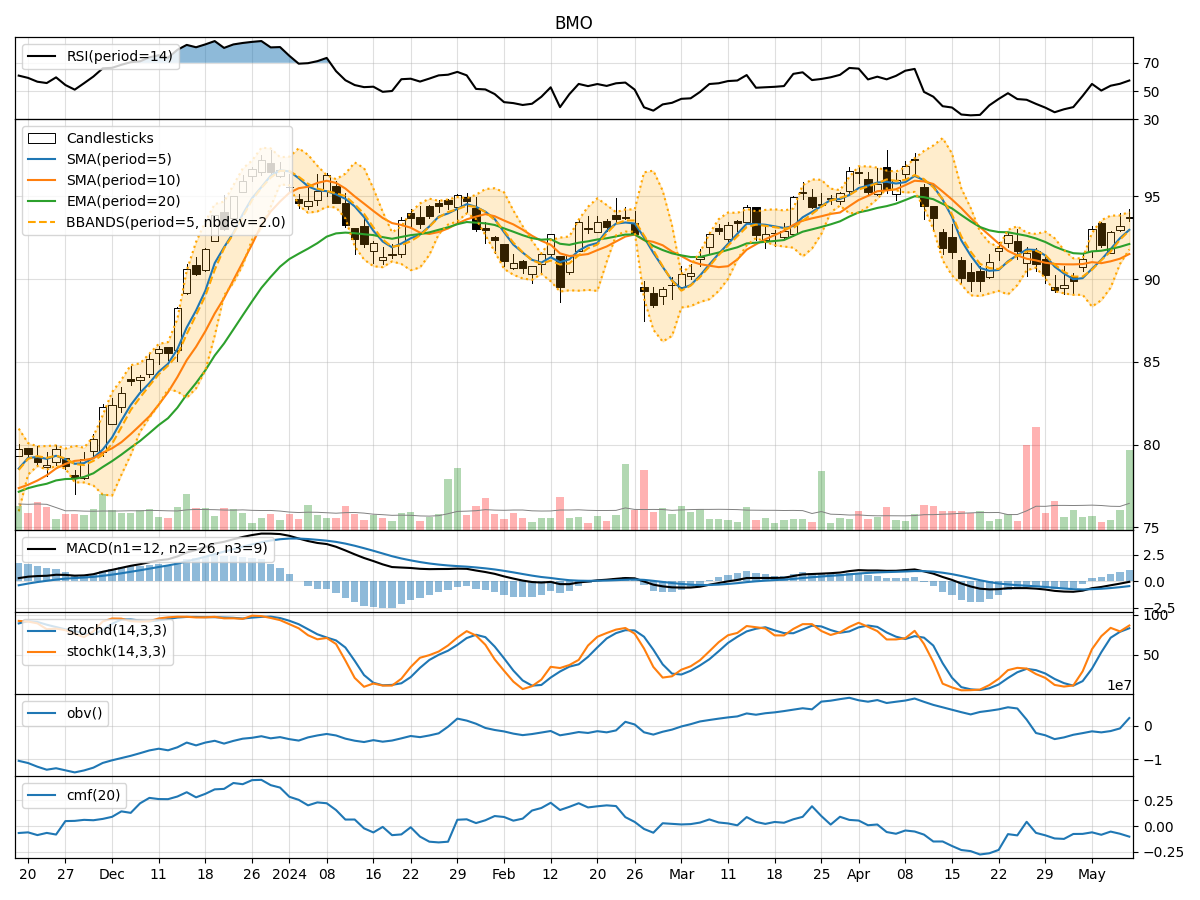
- Moving Averages (MA): The 5-day moving average has been consistently above the simple moving average (SMA) of 10 days, indicating a short-term bullish trend.
- Exponential Moving Average (EMA): The EMA has been showing an upward trend, suggesting positive price momentum.
- Moving Average Convergence Divergence (MACD): The MACD line has been above the signal line, indicating bullish momentum.
- Conclusion: The trend indicators suggest an upward momentum in the stock price.
Momentum Indicators:
- Relative Strength Index (RSI): RSI has been fluctuating around the neutral zone, indicating a balanced momentum.
- Stochastic Oscillator: Both %K and %D have been in the overbought territory, suggesting a potential reversal.
- Williams %R (Willams %R): The Williams %R is also in the overbought region, signaling a possible pullback.
- Conclusion: The momentum indicators imply a potential consolidation or a slight pullback in the stock price.
Volatility Indicators:
- Bollinger Bands (BB): The stock price has been trading within the bands, indicating moderate volatility.
- Conclusion: Volatility is relatively stable, suggesting a sideways movement in the stock price.
Volume Indicators:
- On-Balance Volume (OBV): The OBV has been increasing, indicating buying pressure.
- Chaikin Money Flow (CMF): The CMF has been negative, suggesting some selling pressure.
- Conclusion: The volume indicators show a mixed sentiment with buying pressure slightly outweighing selling pressure.
Conclusion:
Based on the analysis of the technical indicators, the stock of BMO is likely to experience upward momentum in the short term, supported by the trend indicators. However, the momentum indicators signal a potential consolidation or pullback due to overbought conditions. The volatility indicators suggest a sideways movement with stable volatility, while the volume indicators indicate a mixed sentiment with a slight bias towards buying pressure.
Recommendation:
Considering the overall analysis, it is advisable to exercise caution and closely monitor the stock price movement. Traders may consider taking profits on existing positions or implementing risk management strategies to navigate potential consolidation or pullback phases. Long-term investors can use any dips as buying opportunities, considering the overall bullish trend in the stock.