Technical Analysis of BNRE 2024-05-10
Overview:
In analyzing the technical indicators for BNRE stock over the last 5 days, we will delve into the trend, momentum, volatility, and volume indicators to provide a comprehensive outlook on the possible stock price movement in the coming days. By examining these key indicators, we aim to offer valuable insights and predictions for potential investors.
Trend Analysis:
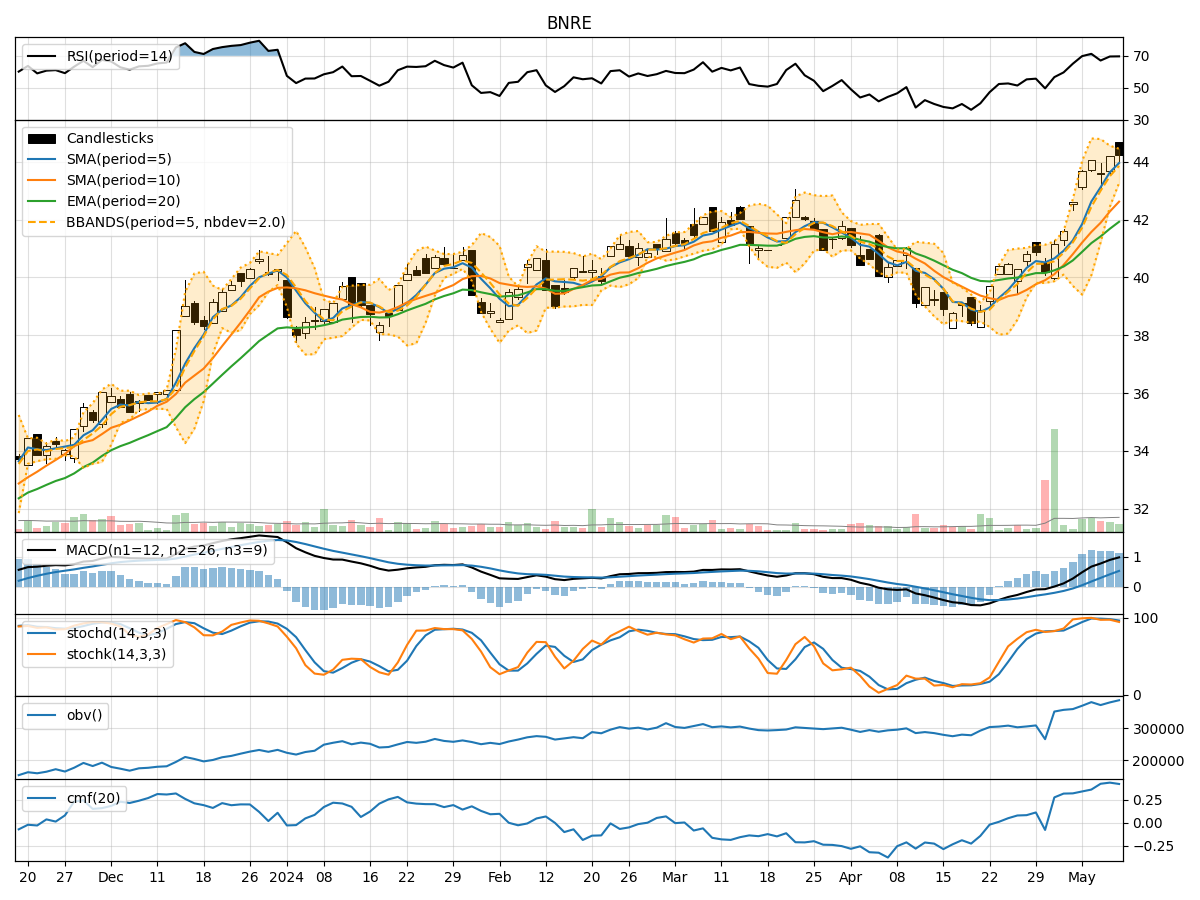
- Moving Averages (MA): The 5-day Moving Average (MA) has been consistently above the Simple Moving Average (SMA) and Exponential Moving Average (EMA), indicating a bullish trend.
- MACD: The MACD line has been consistently above the signal line, with both lines showing an upward trend, suggesting bullish momentum.
- RSI: The Relative Strength Index (RSI) has been hovering around 70, indicating overbought conditions but still supporting the bullish trend.
Momentum Analysis:
- Stochastic Oscillator: The Stochastic Oscillator has been fluctuating but generally staying in the overbought territory, suggesting strong bullish momentum.
- Williams %R: The Williams %R indicator has been consistently in the oversold region, indicating a potential reversal in the bullish momentum.
Volatility Analysis:
- Bollinger Bands (BB): The Bollinger Bands have been narrowing, indicating decreasing volatility and a possible period of consolidation.
- BB %B: The %B indicator has been fluctuating around 0.8, suggesting that the stock price is closer to the upper band, potentially signaling a short-term pullback.
Volume Analysis:
- On-Balance Volume (OBV): The OBV has been steadily increasing, indicating strong buying pressure and supporting the bullish trend.
- Chaikin Money Flow (CMF): The CMF has been positive, indicating that money is flowing into the stock, further supporting the bullish sentiment.
Conclusion:
Based on the analysis of the technical indicators, the BNRE stock is currently in a strong bullish trend supported by positive momentum, increasing buying pressure, and relatively low volatility. However, some indicators suggest potential overbought conditions and a short-term pullback may be on the horizon. Therefore, while the overall outlook remains bullish, investors should be cautious of a possible correction in the near term.
Recommendation:
Considering the overall bullish sentiment but being mindful of potential short-term corrections, investors may consider buying on dips or holding existing positions with a close eye on key support levels. It is essential to monitor the indicators closely for any signs of a trend reversal or increased selling pressure. As always, risk management and setting stop-loss orders are crucial in navigating the market volatility.