Technical Analysis of BR 2024-05-10
Overview:
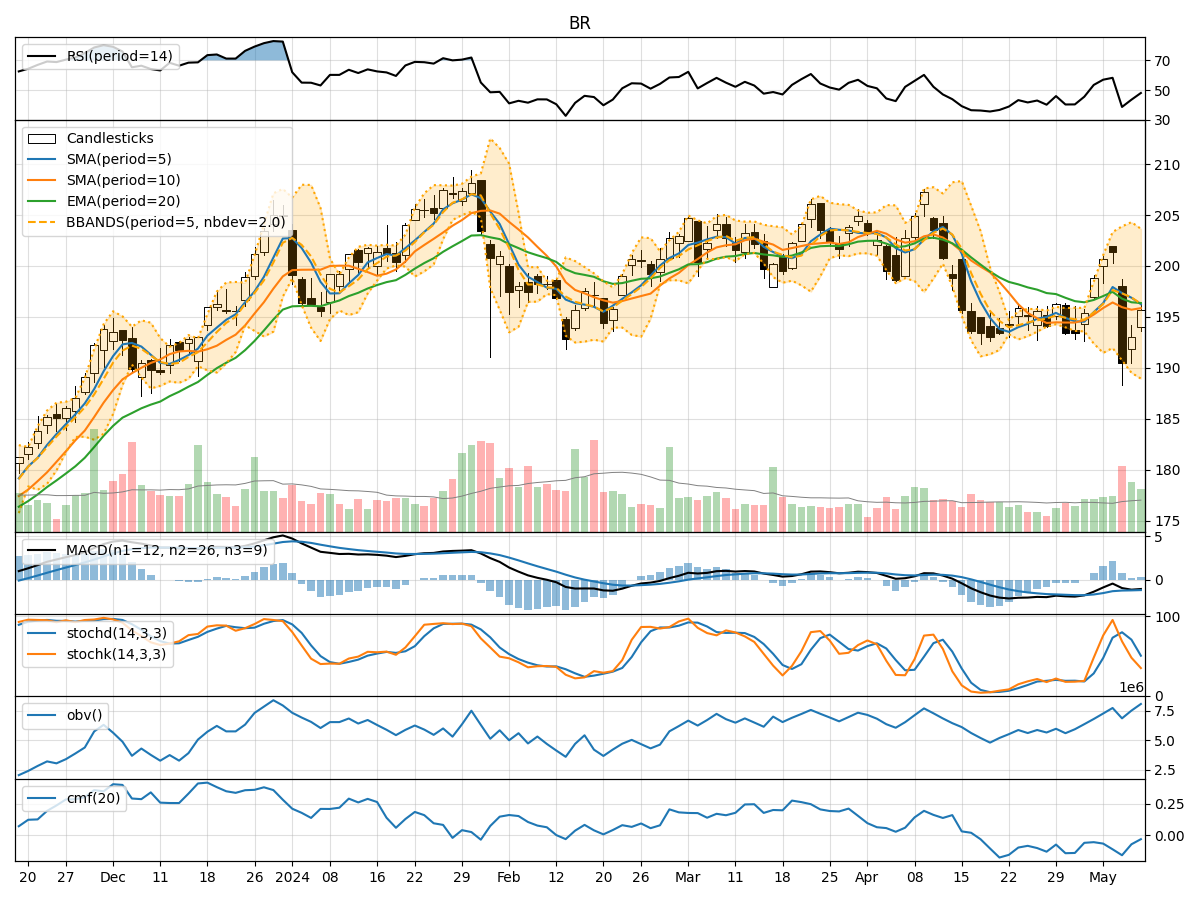
In the last 5 trading days, BR stock has shown some fluctuations in price and volume. The trend indicators suggest a slightly bearish sentiment, with the moving averages and MACD signaling a potential downward trend. Momentum indicators also indicate a weakening bullish momentum. Volatility indicators show a narrowing Bollinger Band, indicating a decrease in price volatility. Volume indicators suggest a slight decrease in buying pressure.
Trend Indicators Analysis:
- Moving Averages (MA): The 5-day MA is below the 10-day SMA, indicating a short-term bearish trend.
- MACD: The MACD line is below the signal line, suggesting a bearish momentum.
- EMA: The EMA is slightly below the current price, indicating a potential downward movement.
Momentum Indicators Analysis:
- RSI: The RSI is in the neutral zone, suggesting a lack of strong buying or selling pressure.
- Stochastic Oscillator: Both %K and %D are below 50, indicating a weakening bullish momentum.
- Williams %R: The indicator is in the oversold territory, suggesting a potential reversal.
Volatility Indicators Analysis:
- Bollinger Bands: The bands are narrowing, indicating decreasing price volatility.
- Bollinger %B: The %B is close to 0.5, suggesting a balanced market sentiment.
Volume Indicators Analysis:
- On-Balance Volume (OBV): The OBV is slightly decreasing, indicating a decrease in buying pressure.
- Chaikin Money Flow (CMF): The CMF is negative, suggesting a lack of strong buying interest.
Key Observations:
- The trend indicators and momentum indicators both point towards a potential downward movement in the stock price.
- Volatility is decreasing, indicating a possible period of consolidation or sideways movement.
- Volume indicators show a slight decrease in buying pressure, which aligns with the bearish sentiment from other indicators.
Conclusion:
Based on the analysis of the technical indicators, the next few days' possible stock price movement for BR is downward. The overall sentiment is bearish, with indicators suggesting a potential continuation of the current downward trend. Traders and investors should exercise caution and consider short-term selling strategies or wait for a clearer bullish signal before considering long positions.