Technical Analysis of BRX 2024-05-10
Overview:
In analyzing the technical indicators for BRX over the last 5 days, we will delve into the trend, momentum, volatility, and volume indicators to provide a comprehensive outlook on the possible stock price movement in the coming days. By examining these key aspects, we aim to offer valuable insights and recommendations for potential investors.
Trend Analysis:
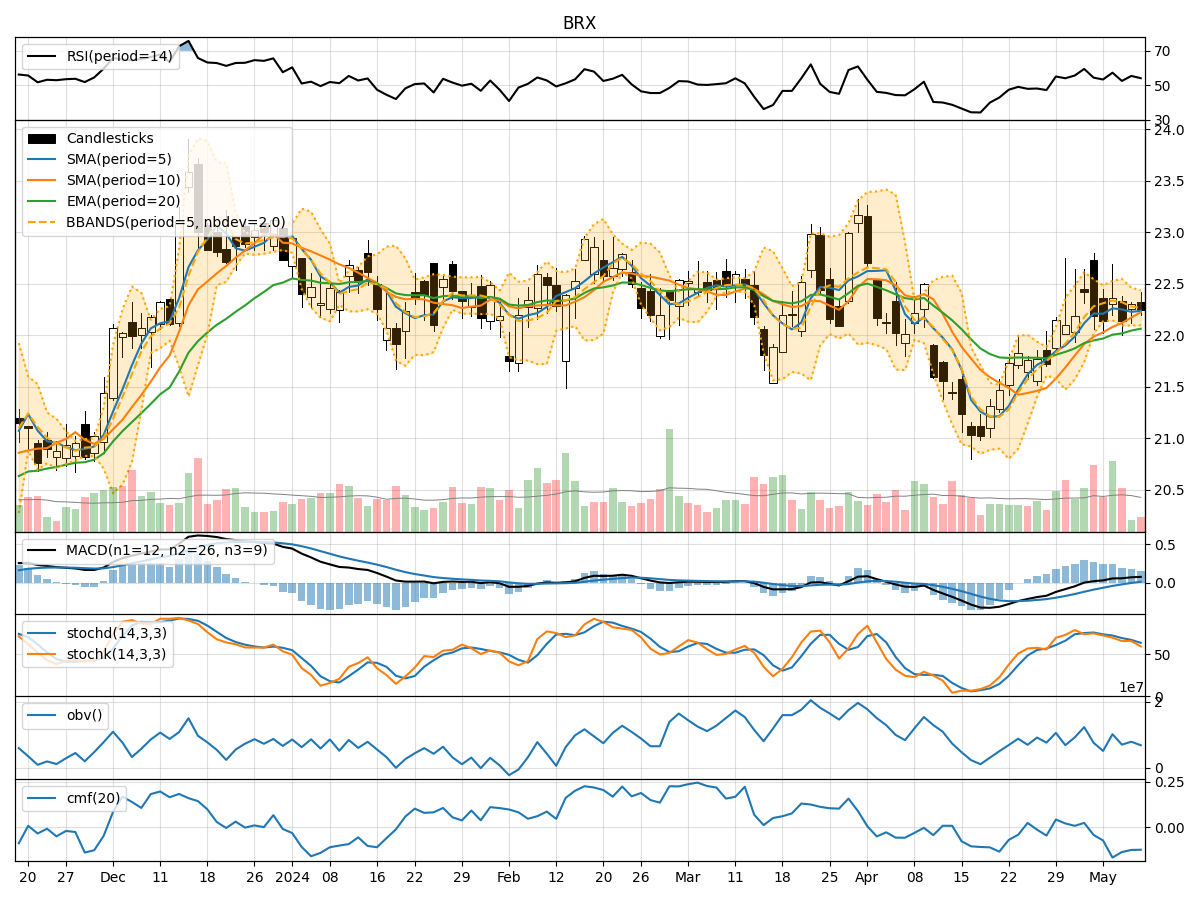
- Moving Averages (MA): The 5-day Moving Average (MA) has been relatively stable around the $22.20 mark, indicating a consistent price level in the short term.
- MACD: The Moving Average Convergence Divergence (MACD) has shown a slight positive trend, with the MACD line crossing above the signal line, suggesting a potential bullish momentum.
- EMA: The Exponential Moving Average (EMA) has been gradually increasing, reflecting a positive price trend.
Key Observation: The trend indicators suggest a mildly bullish sentiment in the short term.
Momentum Analysis:
- RSI: The Relative Strength Index (RSI) has been hovering around the mid-level, indicating a neutral momentum.
- Stochastic Oscillator: Both %K and %D lines of the Stochastic Oscillator have been declining, signaling a potential bearish momentum.
- Williams %R: The Williams %R is in the oversold territory, suggesting a possible reversal in the near future.
Key Observation: Momentum indicators are mixed, with a slight bearish bias.
Volatility Analysis:
- Bollinger Bands: The Bollinger Bands have shown a narrowing of the bands, indicating decreasing volatility.
- Bollinger %B: The %B indicator is below 1, suggesting the price is trading below the upper band.
Key Observation: Volatility indicators point towards a period of consolidation or a potential price breakout.
Volume Analysis:
- On-Balance Volume (OBV): The OBV has been fluctuating, indicating indecision among market participants.
- Chaikin Money Flow (CMF): The CMF has been negative, reflecting selling pressure in the stock.
Key Observation: Volume indicators suggest a lack of strong buying interest and a potential bearish sentiment.
Conclusion:
Based on the analysis of the technical indicators, the next few days for BRX could see sideways movement with a slight bearish bias. The trend indicators hint at a mild bullish sentiment, while momentum indicators show a mixed picture with a bearish bias. Volatility indicators suggest a period of consolidation, and volume indicators indicate a lack of strong buying interest.
Recommendation: It is advisable to closely monitor the price action and key support levels in the coming days to assess the potential for a breakout or a reversal. Consider implementing risk management strategies to navigate the current market conditions effectively.