Technical Analysis of BSX 2024-05-10
Overview:
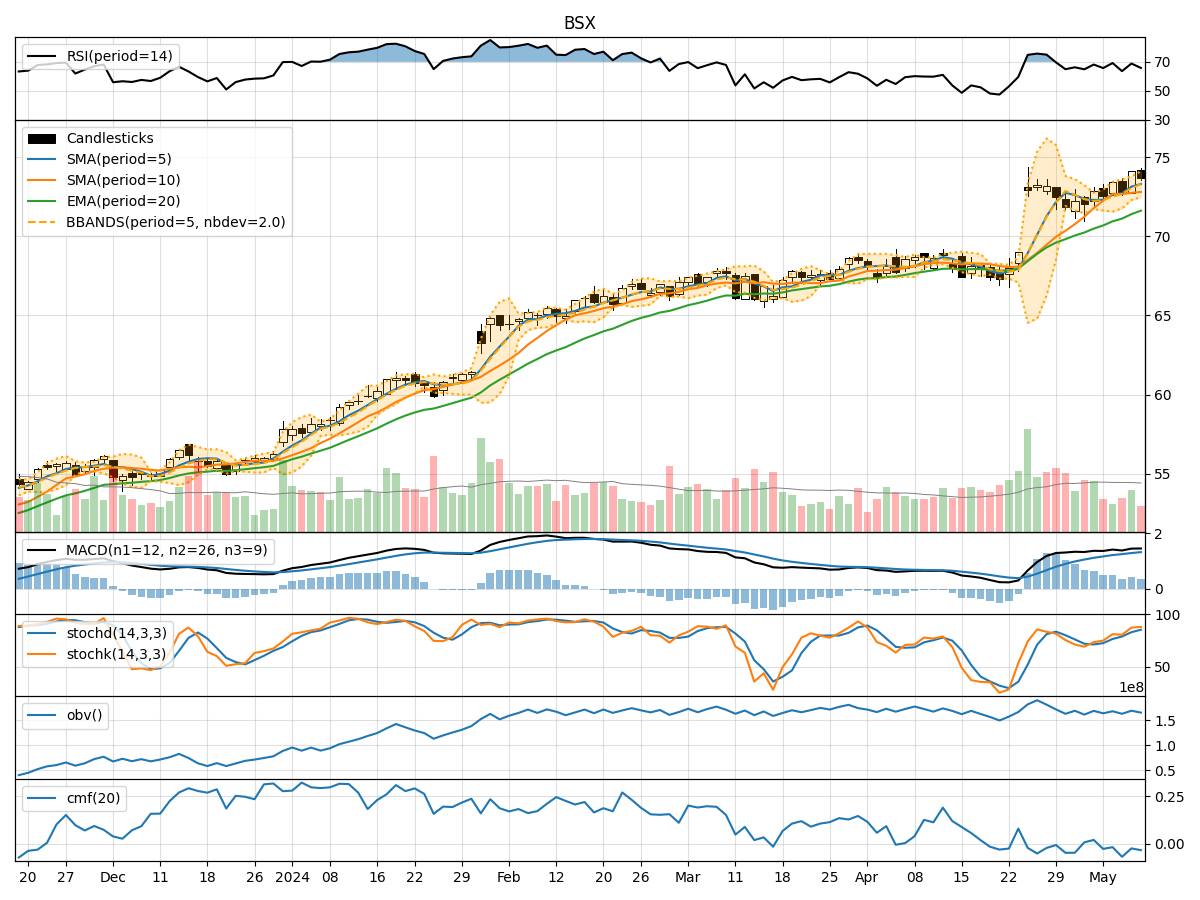
In analyzing the technical indicators for BSX over the last 5 days, we will delve into the trend, momentum, volatility, and volume indicators to provide a comprehensive outlook on the possible stock price movement. By examining these key aspects, we aim to offer valuable insights and recommendations for potential future price trends.
Trend Analysis:
- Moving Averages (MA): The 5-day Moving Average (MA) has been consistently above the Simple Moving Average (SMA) and Exponential Moving Average (EMA), indicating a bullish trend.
- MACD: The MACD line has been consistently above the Signal line, suggesting a positive momentum in the stock price.
Momentum Analysis:
- RSI: The Relative Strength Index (RSI) has been fluctuating around the 70 level, indicating a neutral to slightly overbought condition.
- Stochastic Oscillator: Both %K and %D have been in the overbought territory, signaling a potential reversal or consolidation.
Volatility Analysis:
- Bollinger Bands (BB): The stock price has been trading within the Bollinger Bands, with the bands widening slightly, indicating increased volatility.
Volume Analysis:
- On-Balance Volume (OBV): The OBV has shown mixed movements, suggesting indecision among market participants.
- Chaikin Money Flow (CMF): The CMF has been negative, indicating selling pressure in the stock.
Key Observations:
- The trend indicators suggest a bullish sentiment in the short term.
- Momentum indicators show a potential overbought condition, signaling a need for caution.
- Volatility has increased slightly, indicating potential price swings.
- Volume indicators reflect mixed signals, with selling pressure evident.
Conclusion:
Based on the analysis of the technical indicators, the next few days' possible stock price movement for BSX is likely to be sideways with a slight upward bias. While the trend remains bullish, the overbought momentum and mixed volume signals suggest a possible consolidation phase. Traders should closely monitor key support and resistance levels for potential entry and exit points. It is advisable to exercise caution and wait for clearer signals before making significant trading decisions.