Technical Analysis of BXP 2024-05-10
Overview:
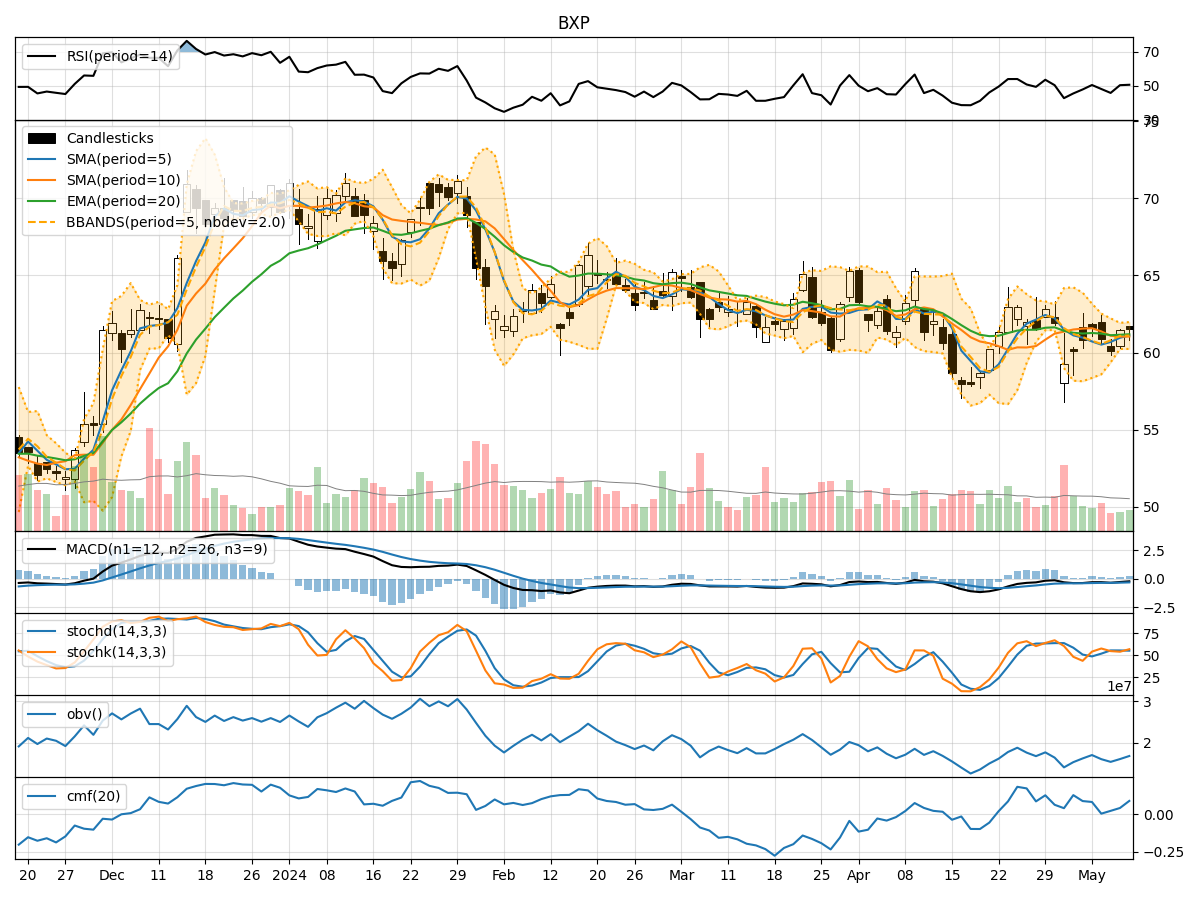
In analyzing the technical indicators for BXP over the last 5 days, we will delve into the trend, momentum, volatility, and volume indicators to provide a comprehensive outlook on the possible stock price movement in the coming days.
Trend Analysis:
- Moving Averages (MA): The 5-day Moving Average (MA) has been fluctuating around the closing prices, indicating short-term price trends.
- MACD: The Moving Average Convergence Divergence (MACD) has shown negative values, suggesting a potential bearish trend.
- EMA: The Exponential Moving Average (EMA) has been relatively stable, reflecting a smoother trend line.
Key Observation: The trend indicators point towards a slightly bearish sentiment in the short term.
Momentum Analysis:
- RSI: The Relative Strength Index (RSI) has been hovering around the mid-level, indicating a balanced momentum.
- Stochastic Oscillator: Both %K and %D have shown mixed signals, with %K crossing %D, suggesting a potential reversal.
- Williams %R: The Williams %R is in the oversold territory, indicating a possible buying opportunity.
Key Observation: Momentum indicators suggest a neutral to slightly bullish momentum in the near future.
Volatility Analysis:
- Bollinger Bands (BB): The Bollinger Bands have been narrowing, indicating decreasing volatility.
- BB% (BB Percentage): The BB% has been relatively low, suggesting a period of consolidation.
- Average True Range (ATR): The ATR has shown a decrease, indicating reduced price fluctuations.
Key Observation: Volatility indicators signal a period of consolidation and potential price stability.
Volume Analysis:
- On-Balance Volume (OBV): The OBV has been fluctuating, indicating mixed buying and selling pressure.
- Chaikin Money Flow (CMF): The CMF has shown a slight increase, suggesting a potential inflow of money into the stock.
Key Observation: Volume indicators reflect a neutral sentiment with no clear direction.
Conclusion:
Based on the analysis of the technical indicators, the stock price of BXP is likely to experience sideways movement in the next few days. The trend indicators point towards a slightly bearish sentiment, while momentum indicators suggest a neutral to slightly bullish momentum. Volatility indicators signal a period of consolidation and stability, and volume indicators reflect a neutral sentiment.
Overall, the stock is expected to trade within a narrow range with no significant directional bias. Traders may consider range-bound strategies or wait for clearer signals before taking significant positions.