Technical Analysis of BXSL 2024-05-10
Overview:
In analyzing the technical indicators for BXSL over the last 5 days, we will delve into the trend, momentum, volatility, and volume indicators to provide a comprehensive assessment of the stock's potential price movement. By examining these key factors, we aim to offer valuable insights and predictions for the next few days.
Trend Analysis:
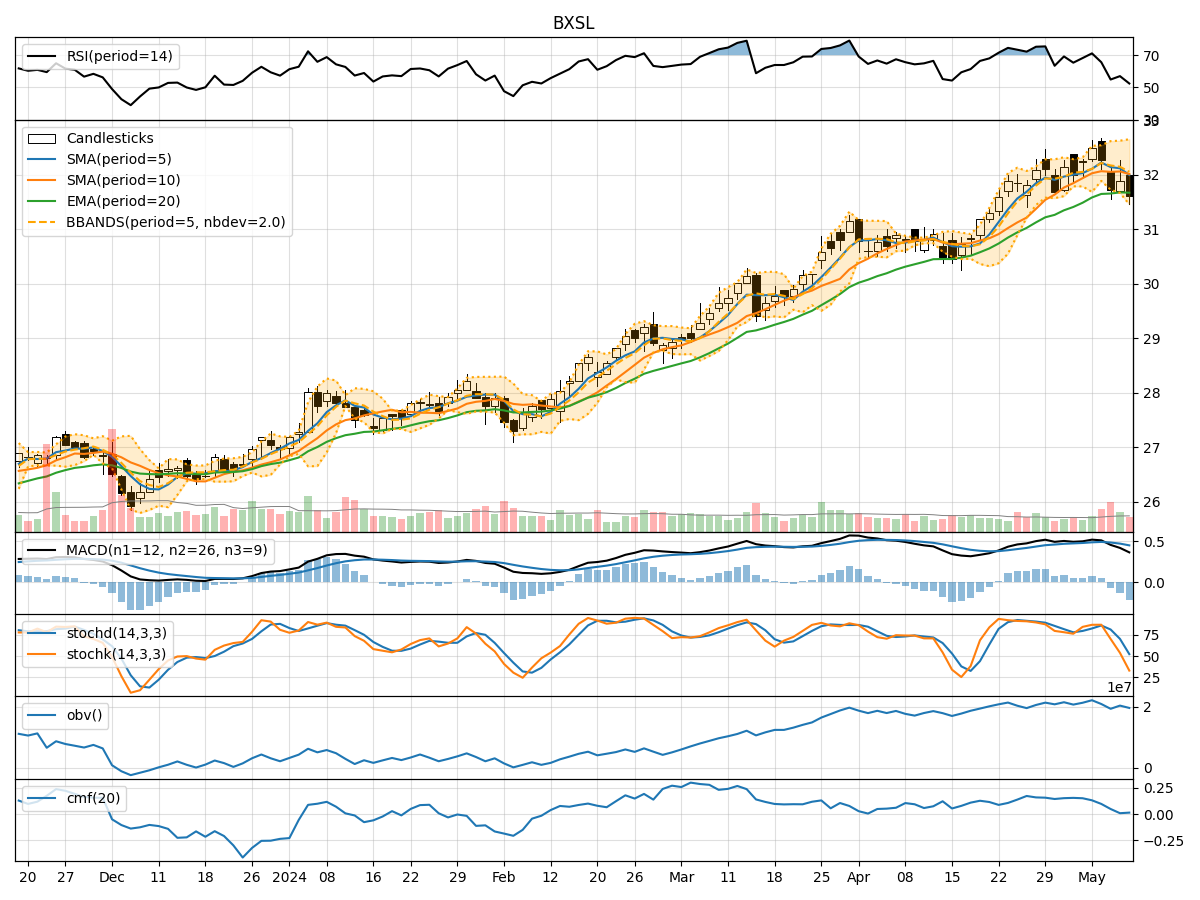
- Moving Averages (MA): The 5-day Moving Average (MA) has been fluctuating around the closing prices, indicating short-term price trends. The Simple Moving Average (SMA) and Exponential Moving Average (EMA) show a slight downward trend, suggesting a potential bearish sentiment.
- MACD: The Moving Average Convergence Divergence (MACD) and its signal line (MACDH) have been decreasing, indicating a weakening bullish momentum.
Momentum Analysis:
- RSI: The Relative Strength Index (RSI) has been declining, moving towards the oversold territory, signaling a potential bearish momentum.
- Stochastic Oscillator: Both %K and %D have been decreasing, indicating a bearish sentiment and potential downward price movement.
Volatility Analysis:
- Bollinger Bands (BB): The Bollinger Bands are narrowing, suggesting decreasing volatility and a possible period of consolidation.
Volume Analysis:
- On-Balance Volume (OBV): The OBV has been fluctuating, indicating indecision among investors regarding the stock.
- Chaikin Money Flow (CMF): The CMF has been decreasing, suggesting a potential outflow of money from the stock.
Key Observations:
- The trend indicators show a bearish sentiment with a downward trend in moving averages and MACD.
- Momentum indicators indicate a bearish momentum with RSI moving towards oversold levels and Stochastic Oscillator showing a bearish sentiment.
- Volatility indicators suggest decreasing volatility and a possible consolidation phase.
- Volume indicators reflect indecision among investors with fluctuating OBV and decreasing CMF.
Conclusion:
Based on the analysis of the technical indicators, the next few days for BXSL are likely to see further downward movement in stock price. The bearish trend, momentum, and volume indicators, coupled with decreasing volatility, point towards a potential continuation of the current downtrend. Traders and investors should exercise caution and consider short-term selling strategies or wait for a clearer bullish reversal signal before considering long positions.