Technical Analysis of CABO 2024-05-10
Overview:
In analyzing the technical indicators for CABO over the last 5 days, we will delve into the trend, momentum, volatility, and volume indicators to provide a comprehensive outlook on the possible stock price movement in the coming days. By examining these key indicators, we aim to offer valuable insights and recommendations for potential investors.
Trend Analysis:
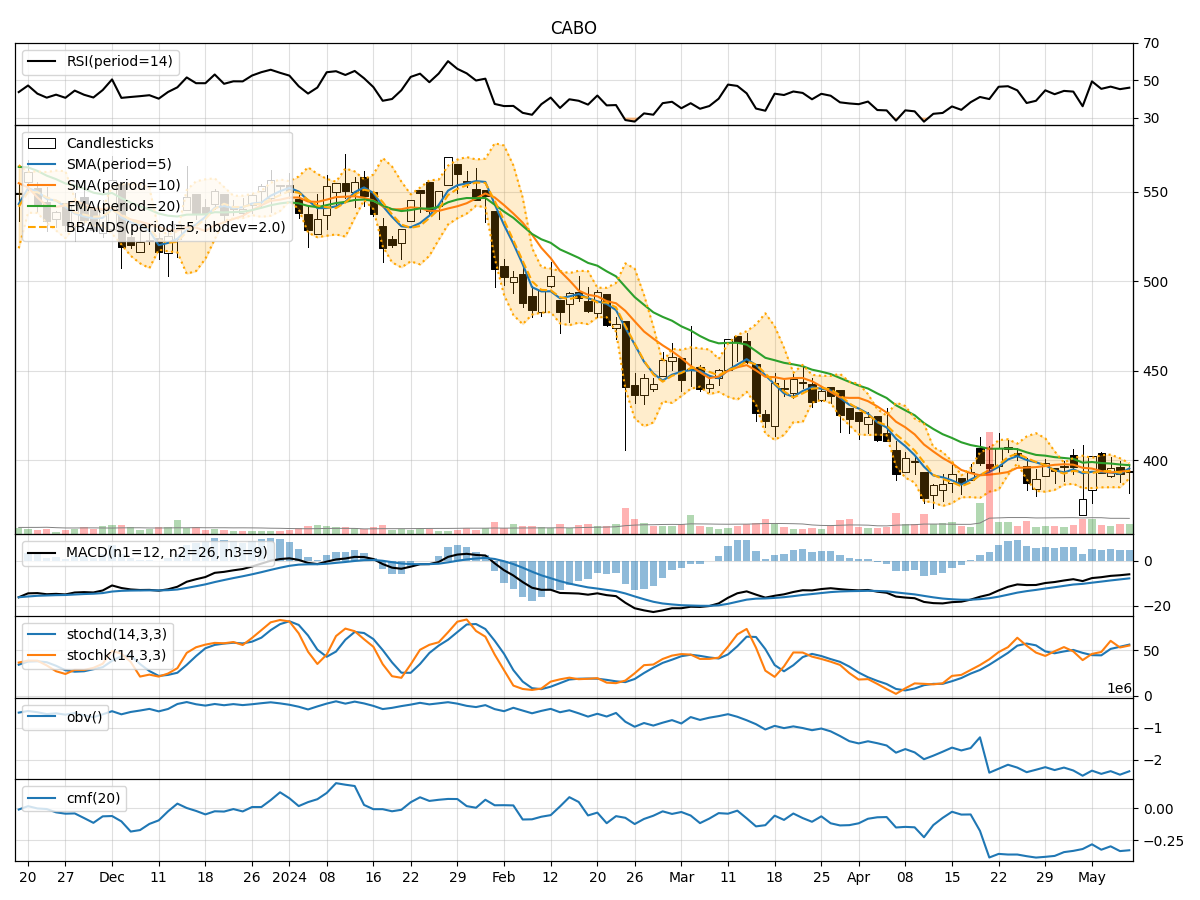
- Moving Averages (MA): The 5-day Moving Average (MA) has been fluctuating around the closing prices, indicating short-term price trends. The Simple Moving Average (SMA) and Exponential Moving Average (EMA) show a slight downtrend, suggesting a bearish sentiment.
- MACD: The Moving Average Convergence Divergence (MACD) is negative, with the MACD line below the signal line, indicating a bearish trend.
- Conclusion: The trend indicators suggest a bearish outlook for CABO in the short term.
Momentum Analysis:
- RSI: The Relative Strength Index (RSI) is hovering around 45-50, indicating a neutral momentum.
- Stochastic Oscillator: The Stochastic Oscillator shows mixed signals, with the %K line crossing the %D line, suggesting potential indecision in the market.
- Conclusion: The momentum indicators reflect a neutral stance, lacking a clear direction for CABO.
Volatility Analysis:
- Bollinger Bands (BB): The Bollinger Bands are narrowing, indicating decreasing volatility and a potential price breakout.
- Conclusion: The volatility indicators suggest a potential price breakout due to the tightening Bollinger Bands.
Volume Analysis:
- On-Balance Volume (OBV): The OBV has been fluctuating, indicating no clear accumulation or distribution pattern.
- Chaikin Money Flow (CMF): The CMF is negative, suggesting selling pressure in the market.
- Conclusion: The volume indicators point towards uncertainty in terms of investor sentiment.
Overall Conclusion:
Based on the analysis of the technical indicators, the next few days for CABO are likely to see a bearish trend continuation in the short term, with neutral momentum and uncertain volume patterns. However, the potential price breakout indicated by the volatility indicators could lead to a short-term price spike. Investors should exercise caution and closely monitor the price action for potential trading opportunities.
Recommendation:
- Short-term Traders: Consider shorting or staying on the sidelines until a clear trend emerges.
- Long-term Investors: Monitor the price breakout potential and consider accumulating positions on dips for a potential upside move.
- Risk Management: Implement stop-loss orders to mitigate potential losses in case of adverse price movements.
By combining the insights from trend, momentum, volatility, and volume indicators, investors can make informed decisions aligned with the current market dynamics. Remember to stay updated on any new developments that may impact CABO's stock price movement.