Technical Analysis of CCK 2024-05-10
Overview:
In analyzing the technical indicators for CCK over the last 5 days, we will delve into the trend, momentum, volatility, and volume indicators to provide a comprehensive outlook on the possible stock price movement in the coming days. By examining these key aspects, we aim to offer valuable insights and recommendations for potential investors.
Trend Analysis:
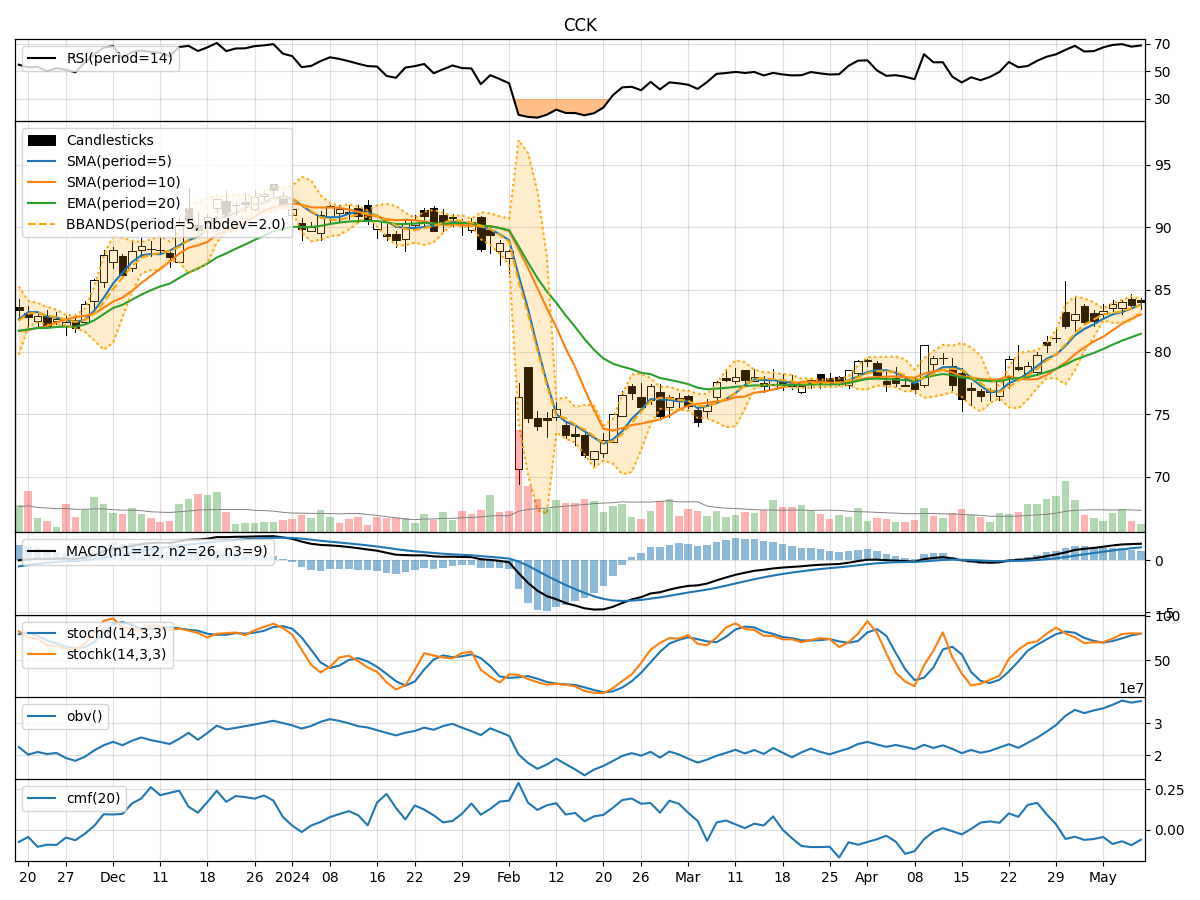
- Moving Averages (MA): The 5-day Moving Average (MA) has been consistently above the closing prices, indicating an upward trend. This suggests that the stock has been gaining strength over the past few days.
- MACD: The MACD line has been above the signal line, with both lines showing an upward trajectory. This confirms the bullish momentum in the stock.
- EMA: The Exponential Moving Average (EMA) has been steadily increasing, further supporting the bullish outlook.
Momentum Analysis:
- RSI: The Relative Strength Index (RSI) has been hovering around 70, indicating that the stock is in overbought territory. This could potentially lead to a short-term pullback or consolidation.
- Stochastic Oscillator: Both %K and %D lines of the Stochastic Oscillator have been in the overbought zone, suggesting a possible reversal or correction in the stock price.
- Williams %R: The Williams %R is also in the overbought region, signaling a potential downward movement in the stock.
Volatility Analysis:
- Bollinger Bands: The Bollinger Bands are narrowing, indicating decreasing volatility in the stock. This could precede a period of consolidation or a breakout in either direction.
- Bollinger %B: The %B indicator is below 1, suggesting that the stock price is currently below the upper Bollinger Band, which could imply a potential buying opportunity.
Volume Analysis:
- On-Balance Volume (OBV): The OBV has been relatively stable, indicating a balance between buying and selling pressure in the stock.
- Chaikin Money Flow (CMF): The CMF has been negative, suggesting distribution rather than accumulation in the stock.
Conclusion:
Based on the analysis of the technical indicators, the stock of CCK is currently exhibiting overbought conditions according to the momentum indicators. This could lead to a short-term correction or consolidation in the stock price. The narrowing Bollinger Bands also suggest a potential period of consolidation before a breakout.
Considering the overall trend, momentum, volatility, and volume indicators, the short-term outlook for CCK appears to be bearish. Investors should exercise caution and consider waiting for a clearer signal before making any trading decisions. It is advisable to monitor the stock closely for any signs of a reversal or confirmation of the current trend.