Technical Analysis of CFR 2024-05-10
Overview:
In analyzing the technical indicators for CFR stock over the last 5 days, we will delve into the trend, momentum, volatility, and volume indicators to provide a comprehensive outlook on the possible stock price movement in the coming days. By examining these key indicators, we aim to offer valuable insights and predictions to guide investment decisions.
Trend Indicators:
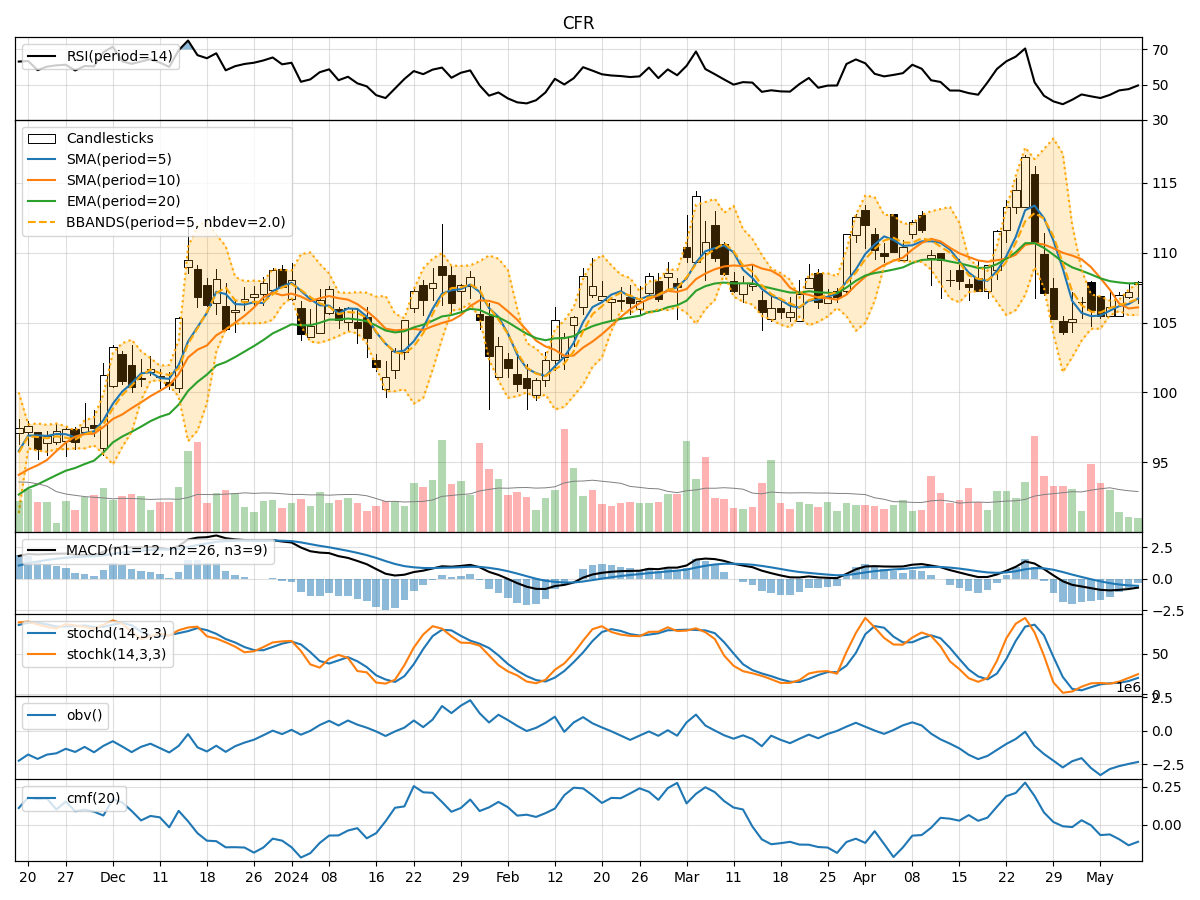
- Moving Averages (MA): The 5-day moving average has been consistently below the longer-term SMAs and EMAs, indicating a short-term downtrend.
- MACD: The MACD line has been below the signal line, suggesting bearish momentum in the stock.
Momentum Indicators:
- RSI: The RSI has been gradually increasing but remains below the overbought threshold, indicating potential room for further upside.
- Stochastic Oscillator: Both %K and %D have been rising, signaling increasing buying pressure.
Volatility Indicators:
- Bollinger Bands: The stock price has been trading within the bands, with the bands widening slightly, indicating increased volatility.
Volume Indicators:
- On-Balance Volume (OBV): The OBV has been declining, suggesting a decrease in buying volume.
- Chaikin Money Flow (CMF): The CMF has been negative, indicating a lack of buying pressure.
Key Observations:
- The trend indicators point towards a short-term downtrend in CFR stock.
- Momentum indicators suggest a potential for a bullish reversal in the near future.
- Volatility has increased slightly, indicating potential price fluctuations.
- Volume indicators show a decrease in buying volume and lack of significant buying pressure.
Conclusion:
Based on the analysis of the technical indicators, the next few days' possible stock price movement for CFR is likely to be sideways with a potential bullish bias. While the trend indicators indicate a short-term downtrend, the momentum indicators suggest a possible bullish reversal. The increased volatility may lead to price fluctuations, but the lack of significant buying volume and pressure could limit substantial upward movement. Traders should closely monitor key levels and wait for confirmation of a bullish trend before considering long positions.