Technical Analysis of CHE 2024-05-10
Overview:
In analyzing the technical indicators for CHE stock over the last 5 days, we will delve into the trend, momentum, volatility, and volume indicators to provide a comprehensive outlook on the possible stock price movement in the coming days. By examining these key indicators, we aim to offer valuable insights and predictions for potential investors.
Trend Indicators:
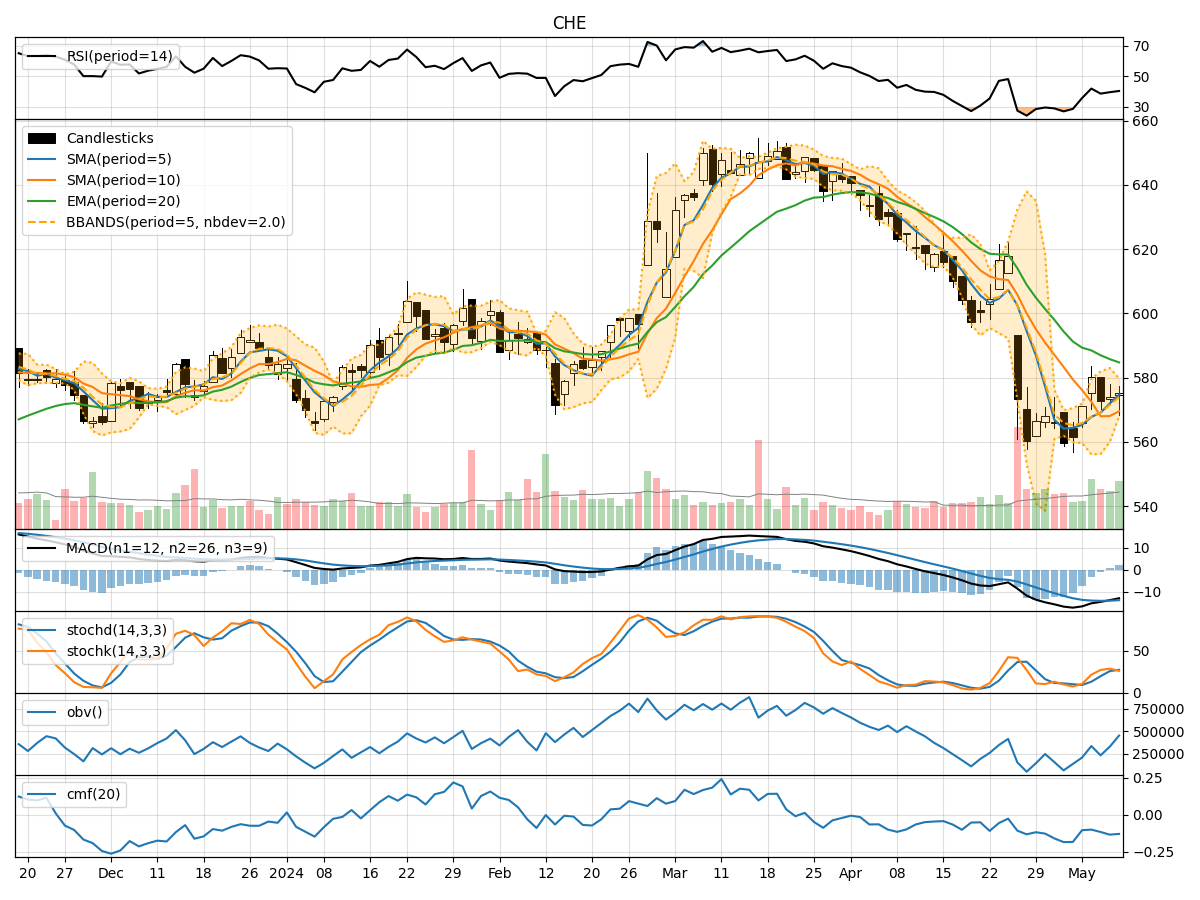
- Moving Averages (MA): The 5-day MA has been fluctuating around the 570-575 range, indicating a relatively stable trend in the short term.
- MACD: The MACD line has been gradually decreasing, suggesting a weakening bullish momentum.
- EMA: The 20-day EMA has been on a downward trend, indicating a bearish sentiment in the medium term.
Key Observation: The trend indicators point towards a potential bearish outlook in the short to medium term.
Momentum Indicators:
- RSI: The RSI has been hovering around 40-45, indicating a neutral sentiment without any extreme overbought or oversold conditions.
- Stochastic Oscillator: Both %K and %D have shown mixed signals, with %K crossing %D, suggesting a potential reversal in momentum.
- Williams %R: The indicator has been in the oversold territory, indicating a possible buying opportunity.
Key Observation: Momentum indicators suggest a neutral to slightly bullish sentiment with a possibility of a reversal in the near future.
Volatility Indicators:
- Bollinger Bands: The bands have been narrowing, indicating decreasing volatility and a potential breakout in the near term.
- Bollinger %B: The %B is relatively low, suggesting a possible oversold condition.
Key Observation: Volatility indicators point towards a potential breakout in the stock price with a bias towards a bullish reversal.
Volume Indicators:
- On-Balance Volume (OBV): The OBV has shown mixed signals, indicating indecision among market participants.
- Chaikin Money Flow (CMF): The CMF has been negative, suggesting a bearish sentiment in the market.
Key Observation: Volume indicators reflect a lack of strong conviction among investors, leading to a neutral to bearish outlook.
Conclusion:
Based on the analysis of the technical indicators, the stock price of CHE is likely to experience a short-term bearish trend with potential for a bullish reversal in the near future. Traders should closely monitor the momentum indicators for signs of a trend reversal, while keeping an eye on the volatility indicators for a potential breakout. It is advisable to exercise caution and wait for confirmation signals before making any significant trading decisions.
Overall View: The stock price of CHE is expected to exhibit a downward bias in the short term followed by a possible bullish reversal in the coming days. Investors should remain vigilant and consider a wait-and-see approach before entering or exiting positions.