Technical Analysis of CHH 2024-05-10
Overview:
In analyzing the technical indicators for CHH over the last 5 days, we will delve into the trend, momentum, volatility, and volume indicators to provide a comprehensive outlook on the possible stock price movement in the coming days. By examining these key aspects, we aim to offer valuable insights and predictions to guide investment decisions.
Trend Indicators:
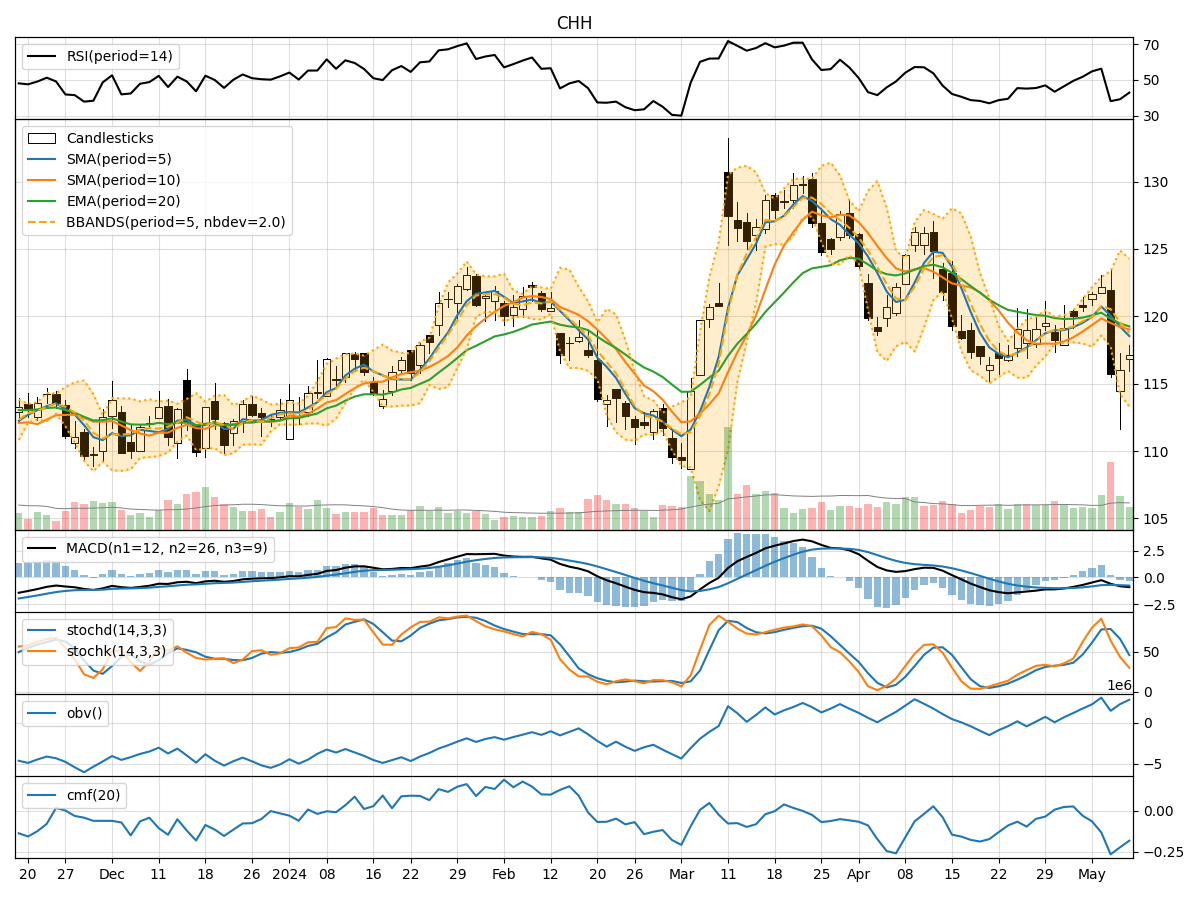
- Moving Averages (MA): The 5-day Moving Average (MA) has been fluctuating around the Simple Moving Average (SMA) and Exponential Moving Average (EMA) values, indicating a lack of clear trend direction.
- MACD: The Moving Average Convergence Divergence (MACD) has been negative, with the MACD line consistently below the signal line, suggesting a bearish momentum.
- MACD Histogram: The MACD Histogram has been decreasing, indicating a weakening bearish momentum.
Momentum Indicators:
- RSI: The Relative Strength Index (RSI) has been hovering around the mid-level, indicating a neutral momentum.
- Stochastic Oscillator: Both %K and %D values have been declining, signaling a bearish momentum.
- Williams %R: The Williams %R has been in the oversold territory, suggesting a potential reversal or continuation of the bearish trend.
Volatility Indicators:
- Bollinger Bands: The Bollinger Bands have been narrowing, indicating decreasing volatility and a potential period of consolidation.
- Bollinger %B: The %B value has been relatively low, suggesting the stock price is closer to the lower band.
Volume Indicators:
- On-Balance Volume (OBV): The OBV has been fluctuating, indicating mixed buying and selling pressure.
- Chaikin Money Flow (CMF): The CMF has been negative, suggesting a bearish money flow trend.
Key Observations and Opinions:
- Trend: The trend indicators show a lack of clear direction, with a slightly bearish bias due to the negative MACD and declining MACD Histogram.
- Momentum: Momentum indicators suggest a bearish sentiment, with the Stochastic Oscillator and Williams %R signaling oversold conditions.
- Volatility: Volatility indicators point towards a period of consolidation, as the Bollinger Bands narrow and %B remains low.
- Volume: Volume indicators reflect mixed trading activity, with the OBV fluctuating and CMF indicating a bearish money flow trend.
Conclusion:
Based on the analysis of the technical indicators, the next few days for CHH are likely to see further downward movement with a potential for consolidation. The bearish momentum indicated by the MACD, Stochastic Oscillator, and Williams %R, coupled with the lack of clear trend direction and mixed volume signals, suggest a cautious approach for investors. Traders may consider short-term bearish strategies or wait for a clearer trend to emerge before making significant investment decisions.