Technical Analysis of CIEN 2024-05-10
Overview:
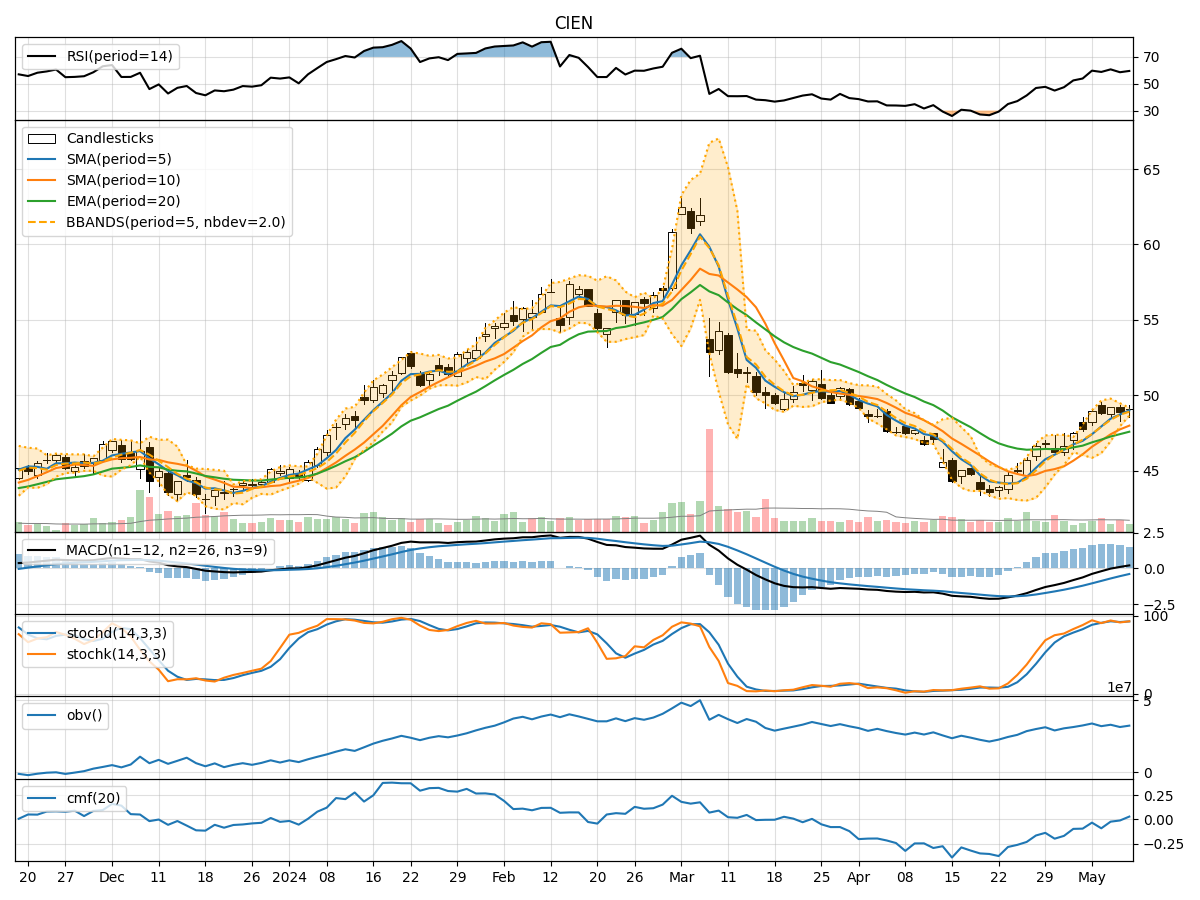
In analyzing the technical indicators for CIEN over the last 5 days, we will delve into the trend, momentum, volatility, and volume indicators to provide a comprehensive outlook on the possible stock price movement. By examining these key indicators, we aim to offer valuable insights and predictions for the upcoming days.
Trend Analysis:
- Moving Averages (MA): The 5-day Moving Average (MA) has been consistently trending upwards, indicating a bullish momentum in the short term.
- MACD: The Moving Average Convergence Divergence (MACD) has shown positive values, suggesting a bullish trend.
- EMA: The Exponential Moving Average (EMA) has been on an upward trajectory, supporting the bullish sentiment in the stock.
Momentum Analysis:
- RSI: The Relative Strength Index (RSI) has been fluctuating around the neutral zone, indicating a balanced momentum without extreme overbought or oversold conditions.
- Stochastic Oscillator: Both %K and %D values have been in the overbought territory, signaling a potential reversal or consolidation in the near future.
- Williams %R: The Williams %R indicator has been hovering in the oversold region, suggesting a possible bullish reversal.
Volatility Analysis:
- Bollinger Bands: The Bollinger Bands have been narrowing, indicating decreasing volatility and a potential period of consolidation.
- Bollinger %B: The %B indicator has been fluctuating within a range, reflecting the consolidation phase in the stock price.
Volume Analysis:
- On-Balance Volume (OBV): The OBV has shown a mixed trend with some days experiencing selling pressure, leading to a slight decline in the indicator.
- Chaikin Money Flow (CMF): The CMF has been negative, indicating a slight outflow of money from the stock.
Key Observations:
- The trend indicators suggest a bullish sentiment in the short term, supported by the positive MACD and EMA values.
- Momentum indicators show a mixed picture with RSI in a neutral zone, Stochastic Oscillator in overbought territory, and Williams %R indicating a potential bullish reversal.
- Volatility indicators point towards a period of consolidation with narrowing Bollinger Bands and fluctuating %B values.
- Volume indicators reflect a slight selling pressure as seen in the OBV and negative CMF values.
Conclusion:
Based on the analysis of the technical indicators, the next few days for CIEN are likely to see sideways movement or consolidation in the stock price. The bullish sentiment from the trend indicators may be offset by the mixed signals from the momentum indicators and the indication of decreasing volatility. Traders and investors should closely monitor key levels and wait for clearer signals before making significant trading decisions.