Technical Analysis of CIG.C 2024-05-10
Overview:
In analyzing the technical indicators for CIG.C over the last 5 days, we will delve into the trend, momentum, volatility, and volume indicators to provide a comprehensive assessment of the stock's potential price movement. By examining these key factors, we aim to offer valuable insights and predictions for the next few days.
Trend Analysis:
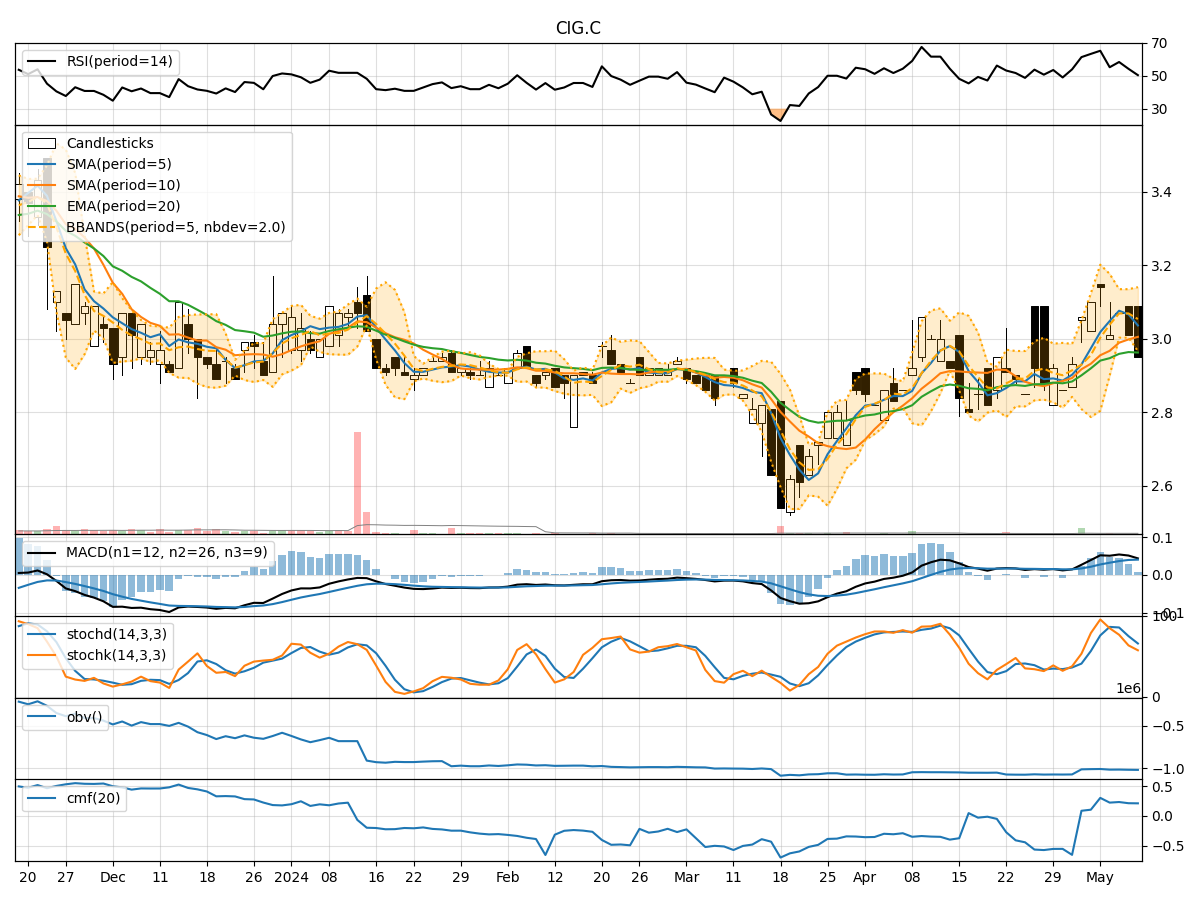
- Moving Averages (MA): The 5-day Moving Average (MA) has been fluctuating around the closing prices, indicating short-term price trends. The Simple Moving Average (SMA) and Exponential Moving Average (EMA) show a slight uptrend, suggesting a positive momentum.
- MACD: The Moving Average Convergence Divergence (MACD) has been positive, with the MACD line consistently above the signal line. This signals a bullish trend in the stock price.
Momentum Analysis:
- RSI: The Relative Strength Index (RSI) has been fluctuating around the 50 level, indicating a neutral momentum in the stock.
- Stochastic Oscillator: The Stochastic indicators show a mixed signal, with the %K and %D lines hovering around the mid-level. This suggests a lack of clear direction in momentum.
Volatility Analysis:
- Bollinger Bands (BB): The Bollinger Bands have been narrowing, indicating decreasing volatility in the stock price. This could potentially lead to a breakout or significant price movement in the near future.
Volume Analysis:
- On-Balance Volume (OBV): The OBV has been slightly negative, indicating some distribution happening in the stock.
- Chaikin Money Flow (CMF): The CMF has been positive but decreasing, suggesting a weakening buying pressure.
Key Observations:
- The trend indicators suggest a bullish sentiment in the short term, supported by the positive MACD.
- Momentum indicators show a lack of clear direction, indicating a possible consolidation phase.
- Volatility is decreasing, which could lead to a breakout or a significant price movement.
- Volume indicators point towards some distribution and weakening buying pressure.
Conclusion:
Based on the analysis of the technical indicators, the next few days for CIG.C could see sideways movement with a potential for a breakout due to decreasing volatility. The bullish trend indicated by the trend indicators might face resistance due to the lack of clear momentum direction. Traders should closely monitor key support and resistance levels for potential entry or exit points.