Technical Analysis of CLS 2024-05-10
Overview:
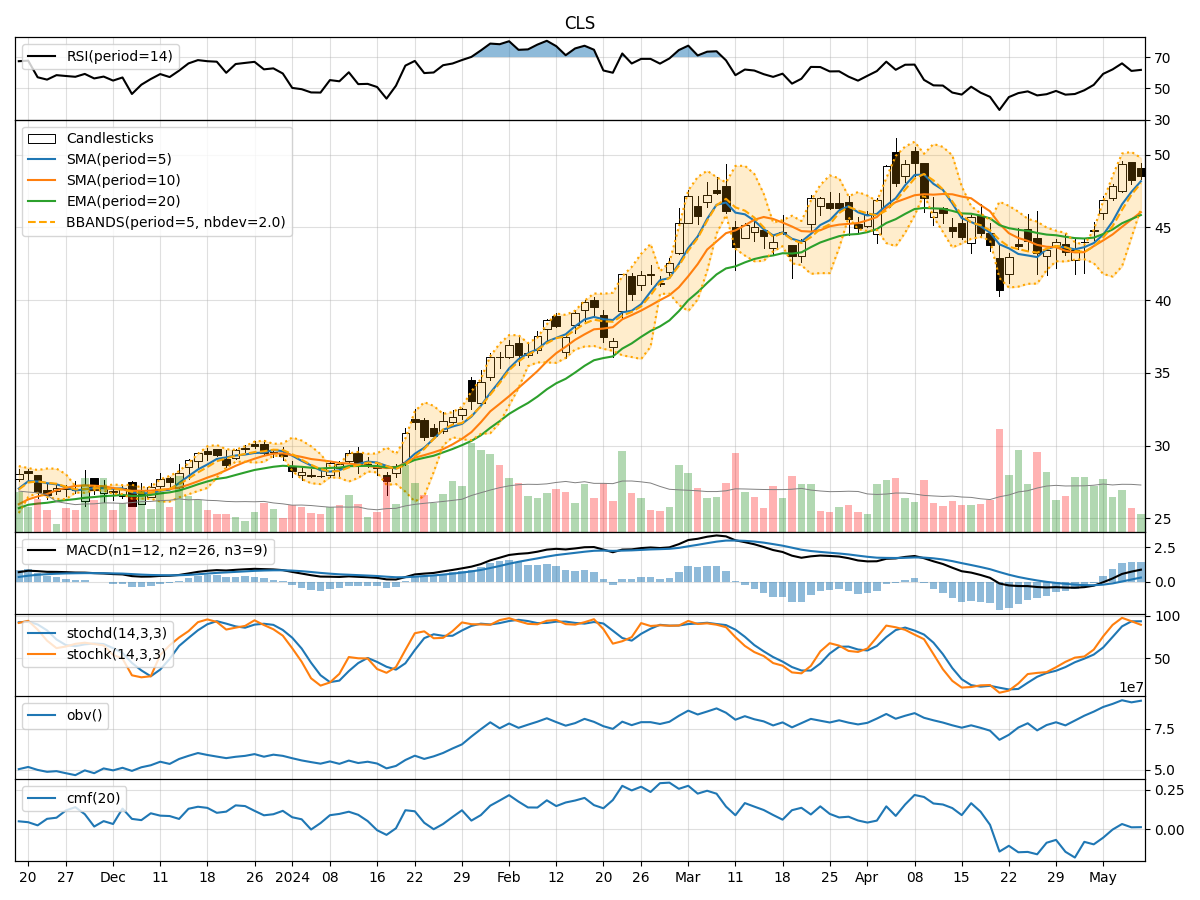
In analyzing the technical indicators for CLS over the last 5 days, we will delve into the trend, momentum, volatility, and volume indicators to provide a comprehensive outlook on the possible stock price movement in the coming days. By examining these key aspects, we aim to offer valuable insights and predictions to guide your investment decisions.
Trend Indicators:
- Moving Averages (MA): The 5-day moving average has been consistently rising, indicating a bullish trend in the short term.
- MACD: The MACD line has been above the signal line for the past few days, suggesting positive momentum.
- EMA: The exponential moving average has also been trending upwards, supporting the bullish sentiment.
Momentum Indicators:
- RSI: The Relative Strength Index has been fluctuating but generally staying within the neutral to overbought territory, suggesting a balanced momentum.
- Stochastic Oscillator: Both %K and %D have been relatively high, indicating strong buying pressure.
- Williams %R: The Williams %R is in the oversold region, signaling a potential reversal in momentum.
Volatility Indicators:
- Bollinger Bands: The stock price has been trading within the upper Bollinger Band, indicating increased volatility and a potential overbought condition.
- Bollinger Band Width: The Band Width has been widening, suggesting a potential increase in volatility.
- Bollinger Band %B: The %B indicator has been above 0.8, indicating a potentially overbought condition.
Volume Indicators:
- On-Balance Volume (OBV): The OBV has been fluctuating but generally trending upwards, indicating accumulation by investors.
- Chaikin Money Flow (CMF): The CMF has been positive, suggesting buying pressure in the stock.
Key Observations and Opinions:
- Trend: The trend indicators suggest a bullish sentiment in the short term, supported by the moving averages and MACD.
- Momentum: Momentum indicators show a mix of bullish and bearish signals, with RSI indicating a neutral stance and Stochastic Oscillator signaling strong buying pressure.
- Volatility: Volatility indicators point towards an increase in volatility, potentially leading to a correction in the stock price.
- Volume: Volume indicators indicate accumulation by investors, supporting the bullish outlook.
Conclusion:
Based on the analysis of the technical indicators, the next few days' possible stock price movement for CLS is likely to be bullish in the short term. The trend indicators support a positive outlook, while momentum indicators show a mix of signals. Volatility is expected to increase, potentially leading to a correction, but the overall volume accumulation suggests continued buying interest. Therefore, the stock is expected to trend upwards in the coming days.