Technical Analysis of CNI 2024-05-10
Overview:
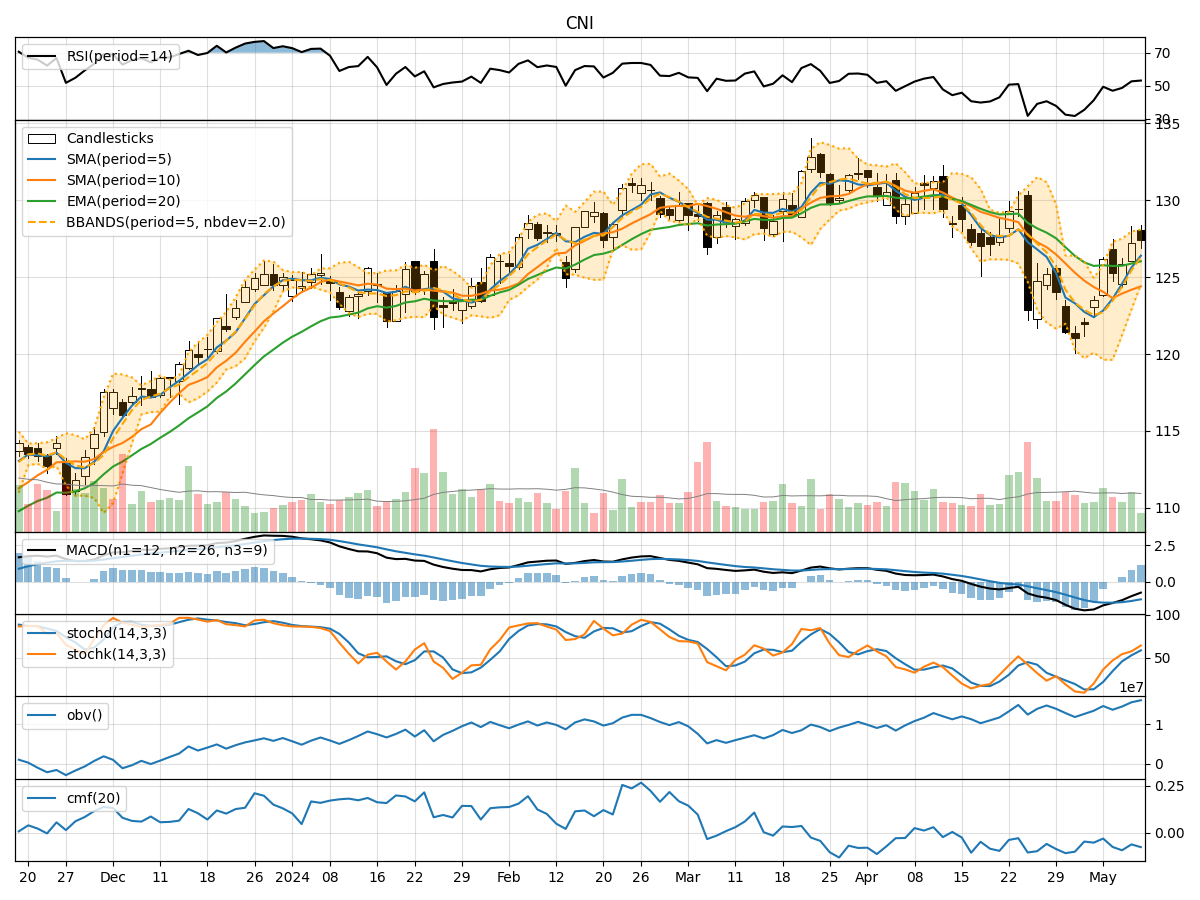
In analyzing the technical indicators for CNI over the last 5 days, we will delve into the trend, momentum, volatility, and volume indicators to provide a comprehensive outlook on the possible stock price movement in the coming days.
Trend Indicators:
- Moving Averages (MA): The 5-day Moving Average (MA) has been consistently rising, indicating a bullish trend in the short term.
- MACD: The Moving Average Convergence Divergence (MACD) has been increasing, with the MACD line crossing above the signal line, suggesting a bullish momentum.
- EMA: The Exponential Moving Average (EMA) has also been on an upward trajectory, supporting the bullish trend.
Momentum Indicators:
- RSI: The Relative Strength Index (RSI) has been increasing, moving towards the overbought territory, indicating a strengthening bullish momentum.
- Stochastic Oscillator: Both %K and %D lines of the Stochastic Oscillator have been rising, signaling increasing buying pressure and potential upward movement.
- Williams %R: The Williams %R is also moving towards the oversold region, indicating a potential reversal to the upside.
Volatility Indicators:
- Bollinger Bands: The Bollinger Bands are narrowing, suggesting decreasing volatility and a possible period of consolidation.
- Bollinger %B: The %B indicator is hovering around the middle, indicating a balanced market sentiment.
Volume Indicators:
- On-Balance Volume (OBV): The OBV has been fluctuating but overall showing a slight decrease, suggesting some distribution.
- Chaikin Money Flow (CMF): The CMF has been negative, indicating selling pressure in the market.
Key Observations:
- The trend indicators, momentum indicators, and volatility indicators all point towards a bullish sentiment in the short term.
- The volume indicators, specifically the OBV and CMF, suggest a slight bearish bias due to the recent distribution and selling pressure.
Conclusion:
Based on the analysis of the technical indicators, the next few days for CNI are likely to see a continuation of the bullish trend with potential upward price movement. However, the slight bearish sentiment indicated by the volume indicators suggests the need for caution as there might be some profit-taking or consolidation in the near future. Traders and investors should closely monitor the price action and volume dynamics to capitalize on potential opportunities while managing risks effectively.