Technical Analysis of CNMD 2024-05-10
Overview:
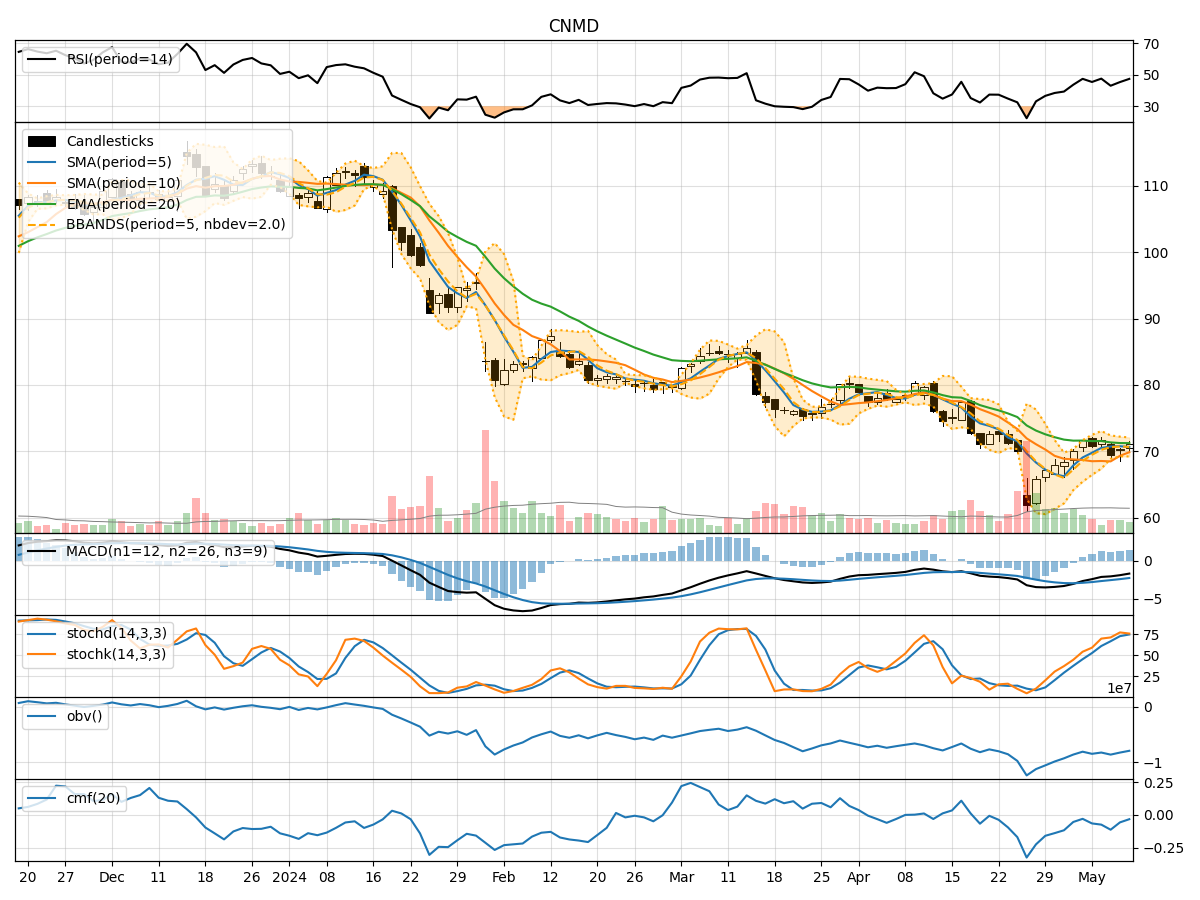
In analyzing the technical indicators for CNMD over the last 5 days, we will delve into the trend, momentum, volatility, and volume indicators to provide a comprehensive outlook on the possible stock price movement in the coming days.
Trend Analysis:
- Moving Averages (MA): The 5-day Moving Average (MA) has been fluctuating around the closing prices, indicating short-term price trends. The Simple Moving Average (SMA) and Exponential Moving Average (EMA) show a slight divergence, suggesting potential price volatility.
- MACD: The Moving Average Convergence Divergence (MACD) has been negative but showing signs of convergence, indicating a possible reversal in the downtrend.
- Conclusion: The trend indicators suggest a potential reversal in the current downtrend towards an upward movement.
Momentum Analysis:
- RSI: The Relative Strength Index (RSI) has been hovering around the neutral zone, indicating a balanced momentum between buying and selling pressure.
- Stochastic Oscillator: Both %K and %D have been in the overbought zone, suggesting a potential pullback in price.
- Conclusion: The momentum indicators imply a neutral stance with a slight bearish bias due to the overbought stochastic levels.
Volatility Analysis:
- Bollinger Bands (BB): The Bollinger Bands have been narrowing, indicating decreasing volatility and a potential breakout in price.
- Conclusion: The volatility indicators suggest a potential price breakout due to the narrowing Bollinger Bands.
Volume Analysis:
- On-Balance Volume (OBV): The OBV has been declining, indicating selling pressure and potential bearish sentiment.
- Chaikin Money Flow (CMF): The CMF has been negative, reflecting a lack of buying interest.
- Conclusion: The volume indicators point towards a bearish sentiment with selling pressure dominating the market.
Overall Conclusion:
Based on the analysis of trend, momentum, volatility, and volume indicators, the next few days for CNMD are likely to see a potential reversal in the downtrend towards an upward movement. However, the momentum remains neutral with a slight bearish bias due to overbought stochastic levels. The volatility indicators suggest a potential breakout in price, while the volume indicators indicate bearish sentiment and selling pressure.
Recommendation:
Considering the overall analysis, it is advisable to exercise caution and closely monitor the price action in the coming days. Traders may consider buying on dips with proper risk management strategies in place. Long-term investors should wait for more confirmation of the potential reversal before making significant decisions.