Technical Analysis of COHR 2024-05-10
Overview:
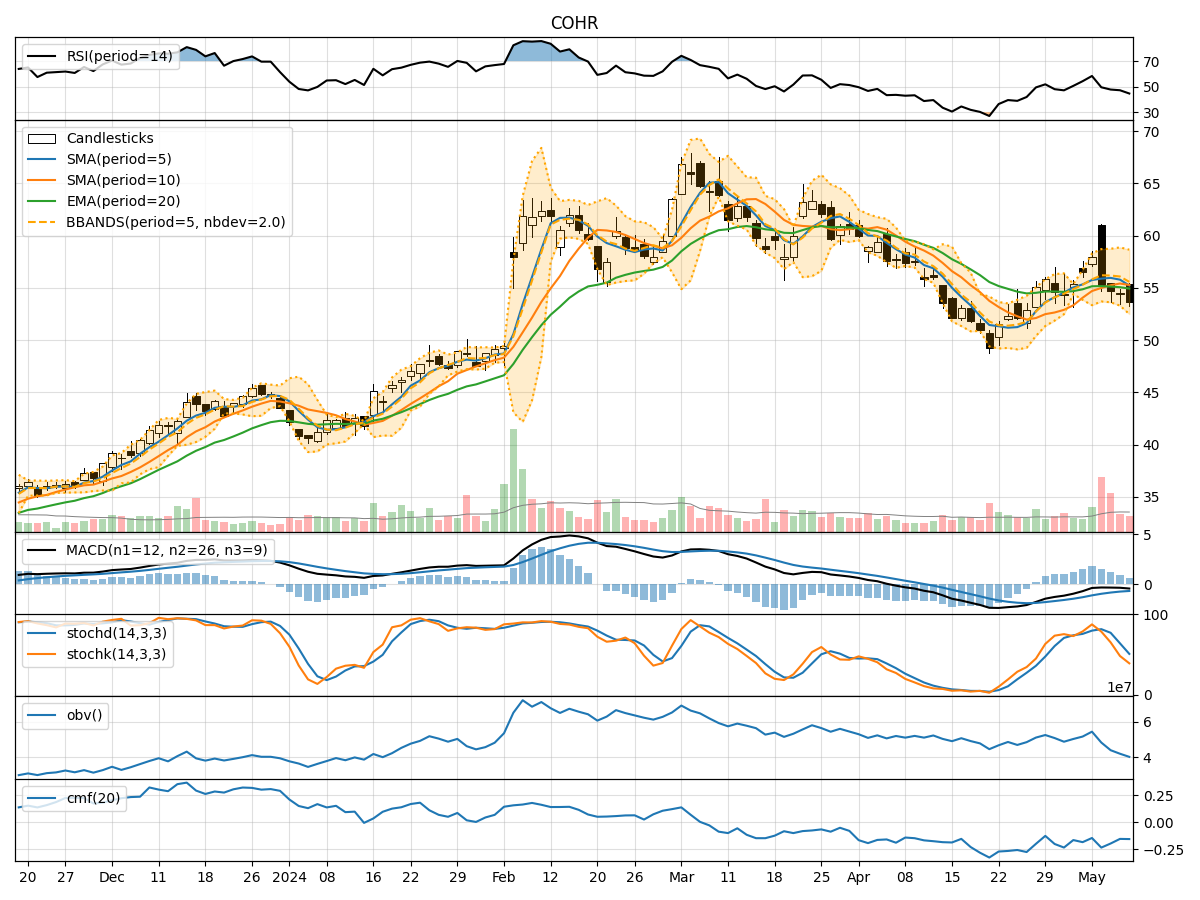
In analyzing the technical indicators for COHR over the last 5 days, we will delve into the trend, momentum, volatility, and volume indicators to provide a comprehensive outlook on the possible stock price movement in the coming days.
Trend Indicators:
- Moving Averages (MA): The 5-day MA has been consistently above the closing prices, indicating a short-term uptrend.
- MACD: The MACD line has been negative, but the MACD histogram has shown signs of convergence, suggesting a potential reversal.
- EMA: The EMA has been relatively stable, indicating a gradual trend.
Key Observation: The trend indicators suggest a mixed outlook with a potential for a reversal in the short term.
Momentum Indicators:
- RSI: The RSI has been declining, indicating a weakening momentum.
- Stochastic Oscillator: Both %K and %D have been decreasing, signaling a bearish momentum.
- Williams %R: The indicator has been in oversold territory, suggesting a potential bounce-back.
Key Observation: Momentum indicators point towards a bearish sentiment with a possibility of a short-term bounce.
Volatility Indicators:
- Bollinger Bands (BB): The stock price has been trading within the lower Bollinger Band, indicating oversold conditions.
- Bollinger Band %B: The %B indicator has been below 0.2, signaling potential undervaluation.
Key Observation: Volatility indicators suggest oversold conditions, potentially leading to a price correction.
Volume Indicators:
- On-Balance Volume (OBV): The OBV has been consistently negative, indicating selling pressure.
- Chaikin Money Flow (CMF): The CMF has been negative, reflecting a lack of buying interest.
Key Observation: Volume indicators confirm the bearish sentiment with a lack of buying support.
Conclusion:
Based on the analysis of the technical indicators, the next few days' possible stock price movement for COHR is likely to experience a short-term bounce from oversold conditions. However, the overall trend remains bearish, with momentum and volume indicators supporting a downward bias. Traders should exercise caution and consider potential reversal signals in the short term.
Key Recommendations:
- Short-term traders: Consider taking advantage of the potential bounce-back for quick gains but remain vigilant of the overall bearish trend.
- Long-term investors: Monitor for signs of trend reversal before considering entry points.
- Risk management: Implement stop-loss strategies to mitigate downside risks in case of further price declines.
By combining insights from trend, momentum, volatility, and volume indicators, traders can make informed decisions aligned with the prevailing market dynamics.