Technical Analysis of COLD 2024-05-10
Overview:
In analyzing the technical indicators for COLD stock over the last 5 days, we will delve into the trend, momentum, volatility, and volume indicators to provide a comprehensive outlook on the possible future stock price movement. By examining these key indicators, we aim to offer valuable insights and predictions for the upcoming trading days.
Trend Analysis:
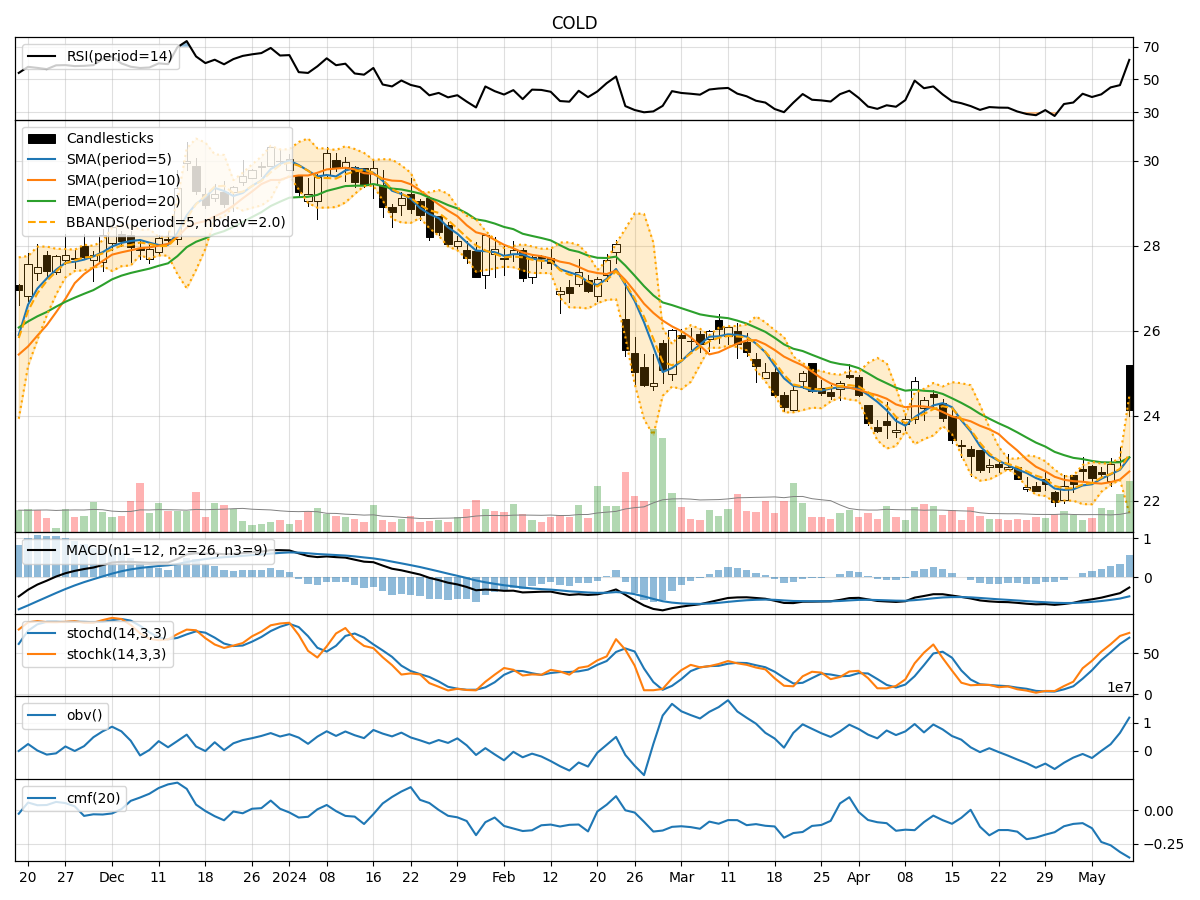
- Moving Averages (MA): The 5-day Moving Average (MA) has been showing an upward trend, indicating a positive momentum in the stock price.
- MACD: The Moving Average Convergence Divergence (MACD) has been consistently negative but showing signs of convergence towards the signal line, suggesting a potential reversal in the trend.
- EMA: The Exponential Moving Average (EMA) has been relatively stable, indicating a gradual price appreciation.
Key Observation: The stock is currently in an uptrend, supported by the moving averages, but the MACD signals a possible trend reversal.
Momentum Analysis:
- RSI: The Relative Strength Index (RSI) has been increasing, indicating strengthening momentum in the stock.
- Stochastic Oscillator: Both %K and %D have been rising, suggesting increasing buying pressure.
- Williams %R: The Williams %R is in the oversold territory, indicating a potential buying opportunity.
Key Observation: Momentum indicators suggest a bullish sentiment with increasing buying pressure and strengthening momentum.
Volatility Analysis:
- Bollinger Bands (BB): The Bollinger Bands have widened, indicating increased volatility in the stock price.
- BB %B: The %B is below 1, suggesting the stock is trading below the lower Bollinger Band, potentially indicating an oversold condition.
Key Observation: The widening Bollinger Bands and %B below 1 indicate heightened volatility and a possible oversold condition.
Volume Analysis:
- On-Balance Volume (OBV): The OBV has been increasing, indicating accumulation of the stock by investors.
- Chaikin Money Flow (CMF): The CMF has been negative, suggesting selling pressure in the stock.
Key Observation: The increasing OBV signals accumulation, while the negative CMF indicates selling pressure.
Conclusion:
Based on the analysis of the technical indicators, the next few days' possible stock price movement for COLD is likely to be bullish. The trend indicators show an ongoing uptrend with potential for a reversal, while momentum indicators suggest increasing buying pressure and strengthening momentum. Volatility remains elevated, indicating potential price swings, and volume indicators point towards accumulation despite some selling pressure.
Overall, the stock is poised for an upward movement in the coming days, supported by positive momentum and trend signals. Traders and investors may consider taking long positions in anticipation of further price appreciation.