Technical Analysis of COUR 2024-05-10
Overview:
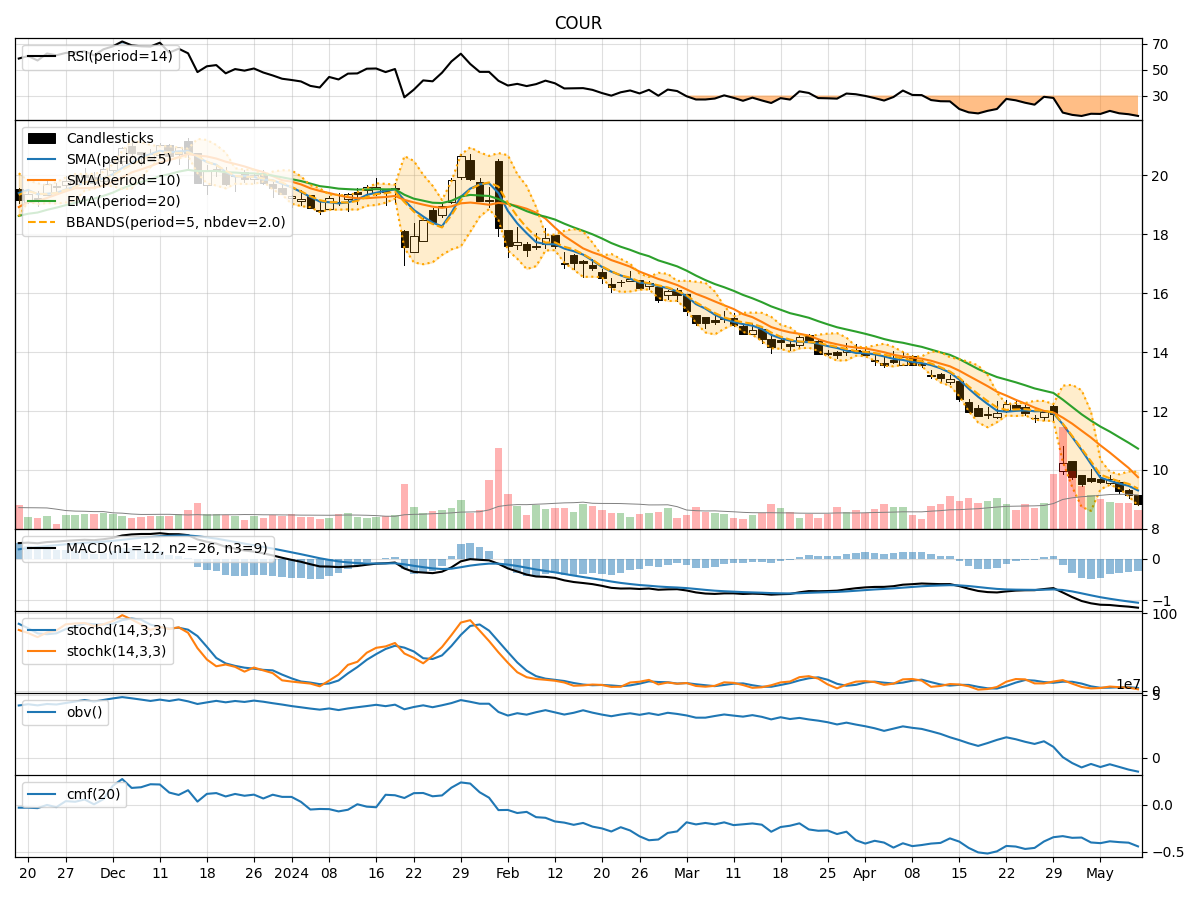
In analyzing the technical indicators for COUR stock over the last 5 days, we will delve into the trend, momentum, volatility, and volume indicators to provide a comprehensive outlook on the possible stock price movement in the coming days.
Trend Analysis:
- Moving Averages (MA): The 5-day moving average has been consistently below the simple moving average (SMA) and exponential moving average (EMA), indicating a downward trend.
- MACD: The MACD line has been below the signal line, with negative values, suggesting bearish momentum.
Momentum Analysis:
- RSI: The Relative Strength Index (RSI) has been low, indicating oversold conditions.
- Stochastic Oscillator: Both %K and %D have been in the oversold region, signaling a potential reversal.
Volatility Analysis:
- Bollinger Bands (BB): The stock price has been consistently below the lower Bollinger Band, indicating oversold conditions.
Volume Analysis:
- On-Balance Volume (OBV): The OBV has been decreasing, suggesting selling pressure.
- Chaikin Money Flow (CMF): The CMF has been negative, indicating a lack of buying interest.
Key Observations:
- The stock is currently in a downtrend based on moving averages and MACD.
- Momentum indicators suggest the stock is oversold and may see a potential reversal.
- Volatility indicators show the stock is oversold based on Bollinger Bands.
- Volume indicators reflect selling pressure and a lack of buying interest.
Conclusion:
Based on the analysis of technical indicators, the next few days' possible stock price movement for COUR is likely to see a short-term rebound or consolidation as the stock is oversold and showing signs of a potential reversal. Traders may consider buying opportunities for a short-term bounce, but long-term investors should exercise caution due to the prevailing downtrend.