Technical Analysis of CPA 2024-05-10
Overview:
In analyzing the technical indicators for CPA stock over the last 5 days, we will delve into the trend, momentum, volatility, and volume indicators to provide a comprehensive outlook on the possible stock price movement in the coming days. By examining these key aspects, we aim to offer valuable insights and predictions to guide investment decisions.
Trend Analysis:
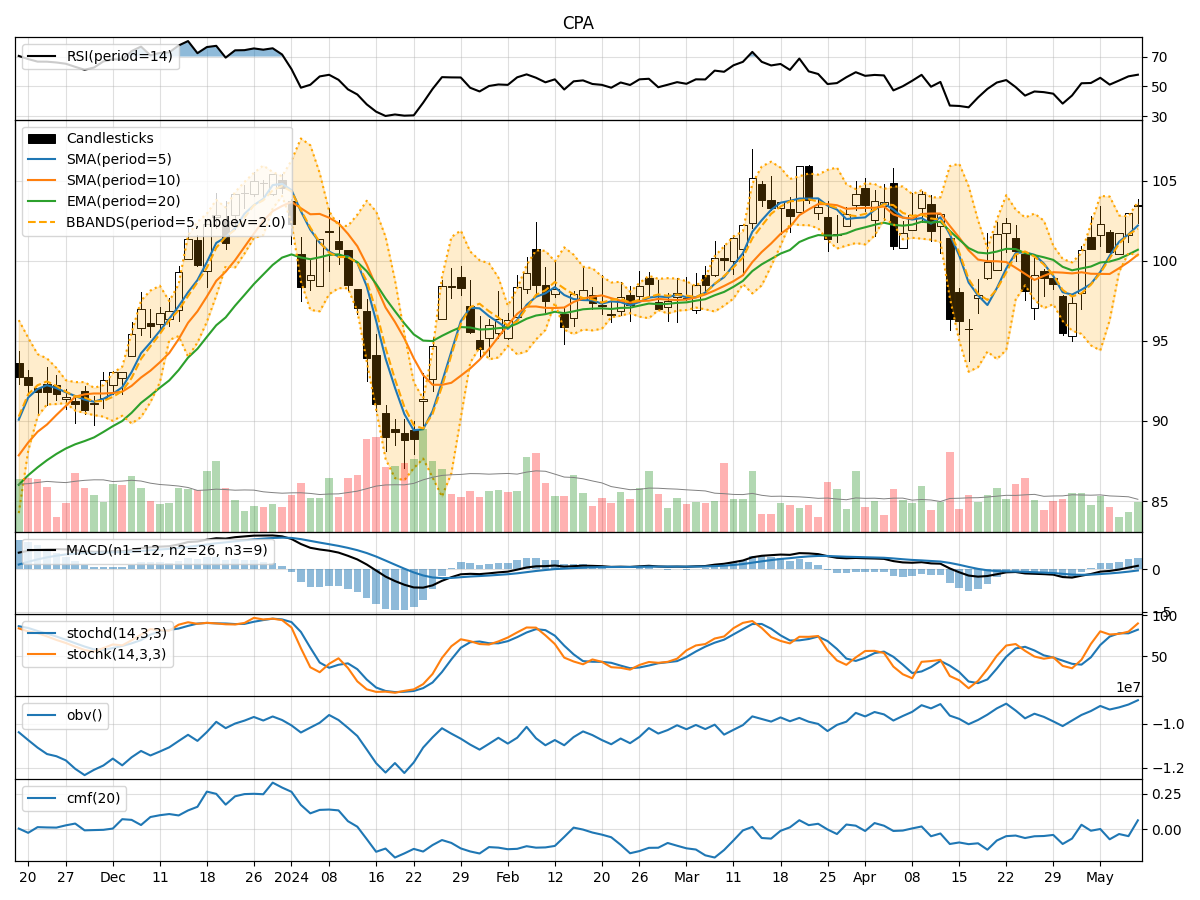
- Moving Averages (MA): The 5-day Moving Average (MA) has been consistently trending above the Simple Moving Average (SMA) and Exponential Moving Average (EMA), indicating a bullish trend.
- MACD: The Moving Average Convergence Divergence (MACD) has shown positive values, with the MACD line consistently above the Signal line, suggesting bullish momentum.
Momentum Analysis:
- RSI: The Relative Strength Index (RSI) has been fluctuating around the 50 level, indicating a neutral momentum in the stock.
- Stochastic Oscillator: Both %K and %D lines of the Stochastic Oscillator have been in the overbought zone, suggesting a potential reversal in the short term.
Volatility Analysis:
- Bollinger Bands (BB): The stock price has been trading within the Bollinger Bands, with the bands narrowing, indicating decreasing volatility.
Volume Analysis:
- On-Balance Volume (OBV): The OBV has shown a slight increase over the last 5 days, indicating accumulation by investors.
- Chaikin Money Flow (CMF): The CMF has been negative, suggesting some selling pressure in the stock.
Key Observations:
- The trend indicators suggest a bullish sentiment in the stock, supported by the positive MACD values.
- Momentum indicators show a neutral stance, with the RSI hovering around the midpoint and stochastic indicators signaling potential overbought conditions.
- Volatility has been decreasing, as indicated by the narrowing Bollinger Bands.
- Volume indicators reflect a slight increase in buying pressure, although the CMF indicates some selling activity.
Conclusion:
Based on the analysis of the technical indicators, the stock price of CPA is likely to experience sideways consolidation in the coming days. While the trend remains bullish, the neutral momentum and potential overbought conditions suggest a period of consolidation. The decreasing volatility and mixed volume signals further support this view. Investors should monitor the stock closely for any signs of a breakout or reversal in the consolidation phase.
Recommendation:
- Short-term Traders: Consider taking profits or reducing positions during consolidation.
- Long-term Investors: Hold positions and wait for clearer signals before making significant changes.
By combining insights from trend, momentum, volatility, and volume indicators, investors can make informed decisions aligned with the current market dynamics.