Technical Analysis of CPB 2024-05-10
Overview:
In analyzing the technical indicators for CPB over the last 5 days, we will delve into the trend, momentum, volatility, and volume indicators to provide a comprehensive outlook on the possible stock price movement in the coming days. By examining these key aspects, we aim to offer valuable insights and predictions to guide investment decisions.
Trend Indicators:
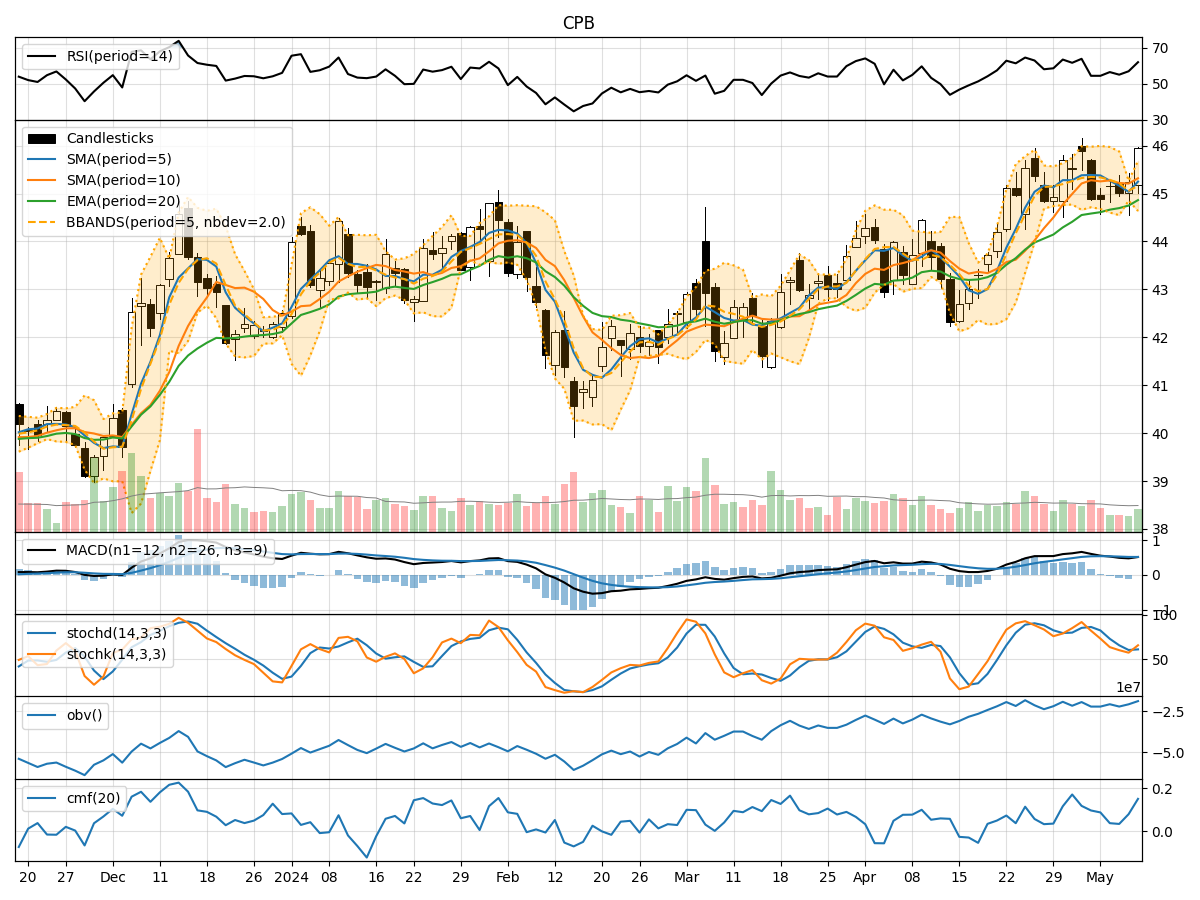
- Moving Averages (MA): The 5-day MA has been fluctuating around the mid $45 range, indicating a relatively stable trend in the short term.
- MACD: The MACD line has been positive, suggesting a bullish momentum in the stock price.
- EMA: The EMA has been gradually increasing, reflecting a positive trend in the stock price.
Key Observation: The trend indicators point towards a bullish sentiment in the stock price movement.
Momentum Indicators:
- RSI: The RSI has been increasing, reaching the overbought territory, indicating a strong buying momentum.
- Stochastic Oscillator: Both %K and %D have been showing upward trends, signaling a bullish momentum.
- Williams %R: The indicator has been fluctuating but remains in the oversold region, suggesting a potential reversal.
Key Observation: Momentum indicators suggest a bullish sentiment with some signs of potential reversal in the short term.
Volatility Indicators:
- Bollinger Bands: The stock price has been trading within the bands, indicating moderate volatility.
- Bollinger %B: The %B has been fluctuating around the mid-range, suggesting a balanced volatility level.
Key Observation: Volatility indicators point towards a sideways movement with moderate fluctuations.
Volume Indicators:
- On-Balance Volume (OBV): The OBV has been increasing, indicating higher buying volume in the stock.
- Chaikin Money Flow (CMF): The CMF has been positive, reflecting a bullish money flow into the stock.
Key Observation: Volume indicators suggest a bullish sentiment with increasing buying volume.
Conclusion:
Based on the analysis of the technical indicators, the overall outlook for CPB stock in the next few days appears to be bullish. The trend indicators, momentum indicators, and volume indicators all point towards a positive sentiment in the stock price movement. While volatility indicators suggest some sideways movement, the overall trend is leaning towards an upward trajectory. Investors may consider taking advantage of the current bullish momentum in CPB stock for potential gains in the short term.