Technical Analysis of CSL 2024-05-10
Overview:
In analyzing the technical indicators for CSL over the last 5 days, we will delve into the trend, momentum, volatility, and volume indicators to provide a comprehensive outlook on the possible stock price movement in the coming days. By examining these key aspects, we aim to offer valuable insights and predictions to guide investment decisions.
Trend Analysis:
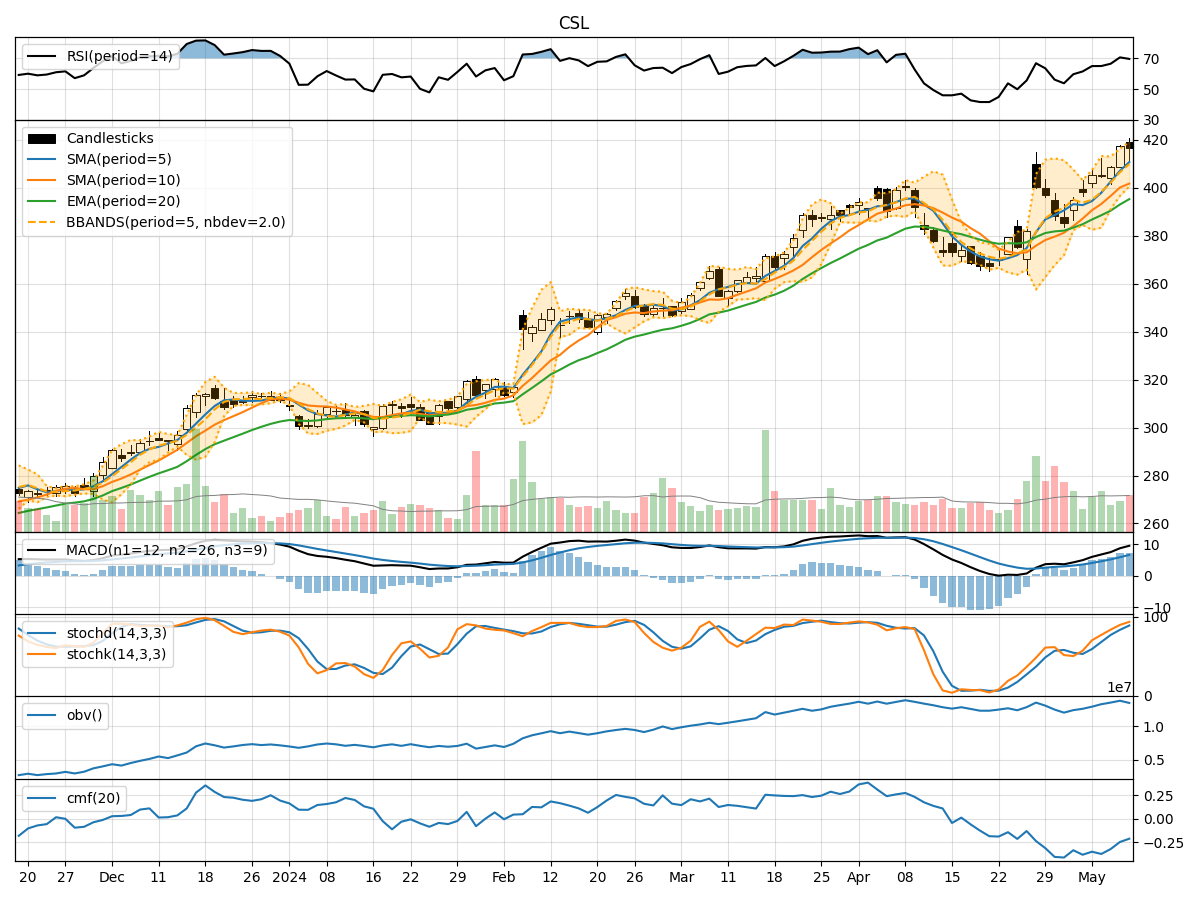
- Moving Averages (MA): The moving averages have been on an upward trend, with the 5-day MA consistently above the longer-term SMAs and EMAs. This indicates a bullish trend in the short to medium term.
- MACD: The MACD line has been increasing, showing positive momentum, and the MACD histogram has been consistently above the signal line, indicating bullish momentum.
Momentum Analysis:
- RSI: The RSI has been in the overbought territory, suggesting a strong bullish momentum in the stock.
- Stochastic Oscillator: Both %K and %D have been in the overbought zone, indicating a potential reversal or consolidation in the near future.
Volatility Analysis:
- Bollinger Bands (BB): The stock price has been trading close to the upper Bollinger Band, indicating high volatility and a potential overbought condition.
- Bollinger Band Width (BBW): The BBW has been relatively high, suggesting increased price volatility.
Volume Analysis:
- On-Balance Volume (OBV): The OBV has been increasing, indicating accumulation by investors.
- Chaikin Money Flow (CMF): The CMF has been negative, suggesting selling pressure in the stock.
Key Observations:
- The stock is currently in a strong bullish trend based on moving averages and MACD.
- Momentum indicators like RSI and Stochastic Oscillator suggest overbought conditions, indicating a potential reversal or consolidation.
- Volatility indicators point to high price volatility, with the stock trading near the upper Bollinger Band.
- Volume indicators show accumulation based on OBV but selling pressure according to CMF.
Conclusion:
Based on the analysis of technical indicators, the stock price of CSL is likely to experience a short-term consolidation or pullback due to the overbought conditions indicated by momentum indicators like RSI and Stochastic Oscillator. However, the overall trend remains bullish based on moving averages and MACD, suggesting that any pullback may present a buying opportunity for investors looking to capitalize on the stock's upward momentum. Traders should exercise caution and consider implementing risk management strategies to navigate the potential volatility in the coming days.