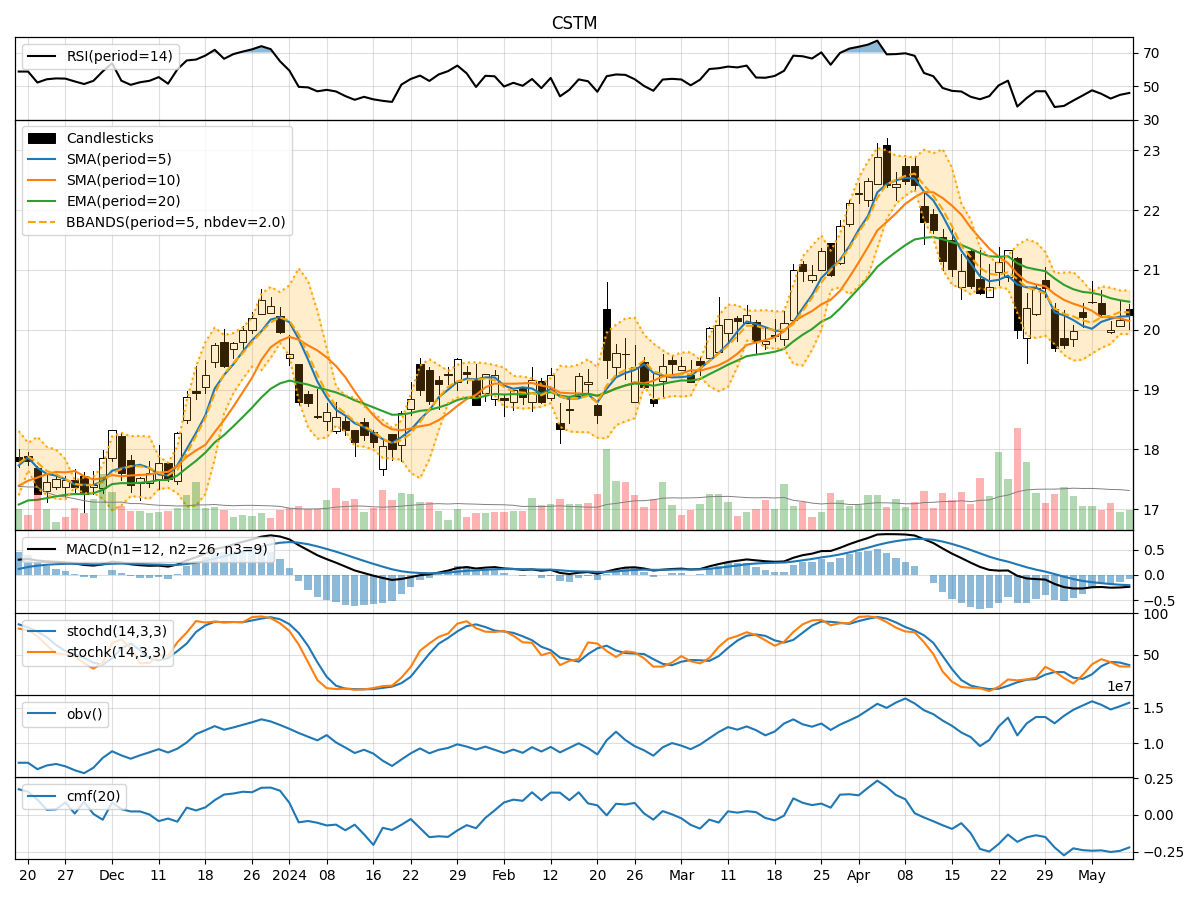
Technical Analysis of CSTM 2024-05-10
Overview:
In analyzing the technical indicators for CSTM over the last 5 days, we will delve into the trend, momentum, volatility, and volume indicators to provide a comprehensive outlook on the possible stock price movement in the coming days. By examining these key aspects, we aim to offer valuable insights and predictions to guide your investment decisions.
Trend Analysis:
- Moving Averages (MA): The 5-day Moving Average (MA) has been hovering around the closing prices, indicating a relatively stable trend.
- MACD: The Moving Average Convergence Divergence (MACD) has been consistently negative, suggesting a bearish momentum in the short term.
- EMA: The Exponential Moving Average (EMA) has been declining, reflecting a weakening trend.
Momentum Analysis:
- RSI: The Relative Strength Index (RSI) has been fluctuating around the midline, indicating indecision in the market.
- Stochastic Oscillator: Both %K and %D have been trending downwards, signaling a potential bearish momentum.
- Williams %R: The Williams %R is approaching oversold territory, suggesting a possible reversal or consolidation.
Volatility Analysis:
- Bollinger Bands: The Bollinger Bands have been narrowing, indicating decreasing volatility and a potential period of consolidation.
- Bollinger %B: The %B indicator is relatively neutral, neither in overbought nor oversold territory.
Volume Analysis:
- On-Balance Volume (OBV): The OBV has been fluctuating, reflecting mixed buying and selling pressure.
- Chaikin Money Flow (CMF): The CMF has been negative, indicating a lack of strong buying interest.
Key Observations:
- The trend indicators suggest a bearish sentiment with declining moving averages and negative MACD.
- Momentum indicators point towards a potential continuation of bearish momentum in the short term.
- Volatility indicators indicate a period of consolidation with decreasing volatility.
- Volume indicators show mixed signals with fluctuating OBV and negative CMF.
Conclusion:
Based on the analysis of the technical indicators, the outlook for CSTM in the next few days is bearish. The trend is weakening, momentum favors the downside, volatility is decreasing, and volume signals mixed market sentiment. Therefore, it is likely that the stock price may experience further downward movement in the near future. Consider a cautious approach or potential short positions until a clearer trend reversal or consolidation pattern emerges.