Technical Analysis of CUBI 2024-05-10
Overview:
In analyzing the technical indicators for CUBI over the last 5 days, we will delve into the trend, momentum, volatility, and volume indicators to provide a comprehensive outlook on the possible stock price movement. By examining these key aspects, we aim to offer valuable insights and predictions for the upcoming days.
Trend Analysis:
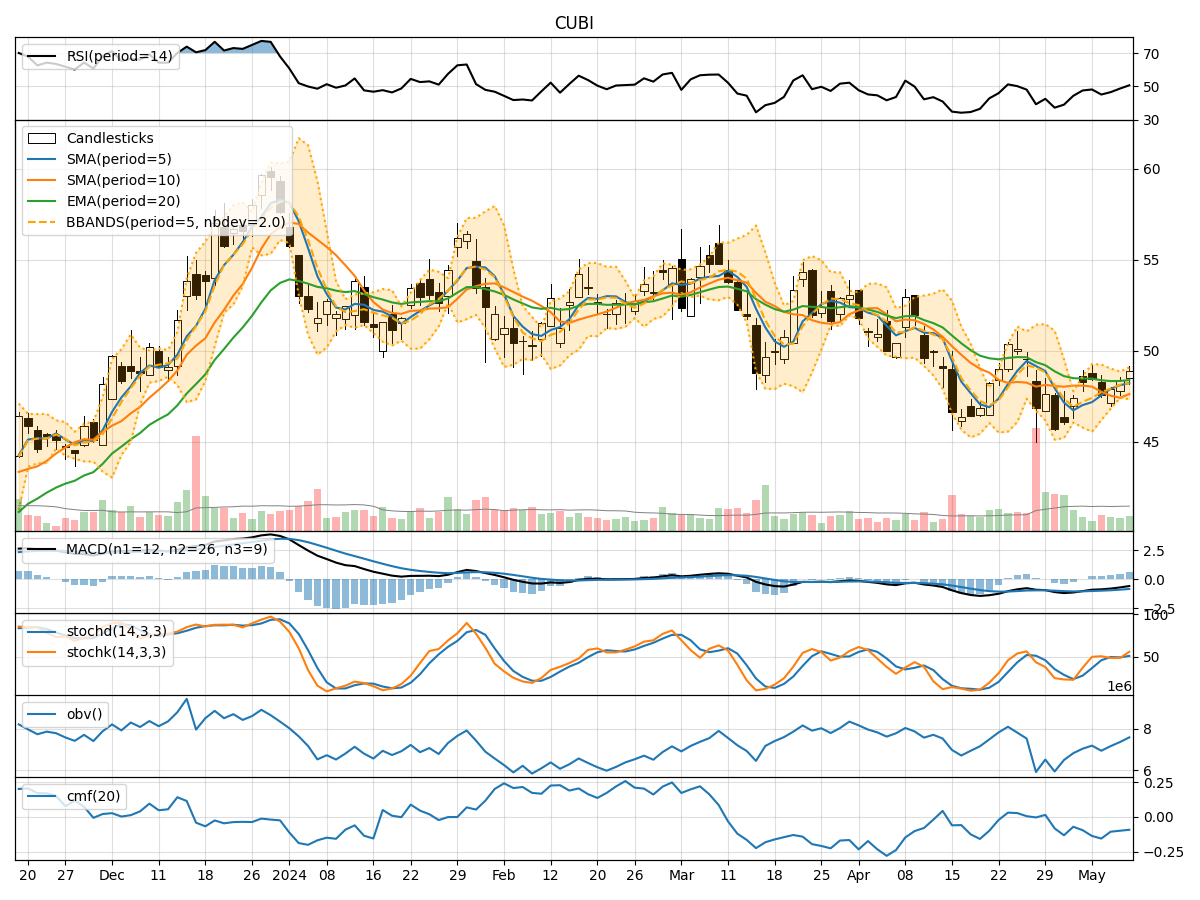
- Moving Averages (MA): The 5-day Moving Average (MA) has been fluctuating around the closing prices, indicating short-term price trends. The Simple Moving Average (SMA) and Exponential Moving Average (EMA) show a slight downward trend, suggesting a potential bearish sentiment.
- Moving Average Convergence Divergence (MACD): The MACD line has been negative, with the MACD Histogram showing a slight increase. This indicates a potential reversal in the bearish momentum.
Momentum Analysis:
- Relative Strength Index (RSI): The RSI has been gradually increasing, reaching above 50, indicating a strengthening momentum.
- Stochastic Oscillator: Both %K and %D lines of the Stochastic Oscillator have been rising, suggesting an upward momentum.
- Williams %R (Willams %R): The Williams %R has been improving, moving away from oversold levels, indicating a potential bullish momentum.
Volatility Analysis:
- Bollinger Bands (BB): The Bollinger Bands have been narrowing, indicating decreasing volatility in the stock price.
- Bollinger Band %B (BB %B): The %B value has been increasing, suggesting a potential breakout or trend reversal.
Volume Analysis:
- On-Balance Volume (OBV): The OBV has been increasing over the last 5 days, indicating accumulation by investors.
- Chaikin Money Flow (CMF): The CMF has been negative, indicating some selling pressure, but the magnitude has been decreasing.
Conclusion:
Based on the analysis of the technical indicators, the stock of CUBI is showing signs of bullish momentum in the short term. The improving RSI, Stochastic Oscillator, and Williams %R suggest a potential upward movement in the stock price. Additionally, the narrowing Bollinger Bands and increasing OBV point towards a possible breakout or uptrend.
Therefore, considering the overall technical analysis, it is likely that CUBI's stock price will experience an upward movement in the next few days. Traders and investors may consider taking long positions or monitoring the stock closely for potential buying opportunities.