Technical Analysis of CUK 2024-05-10
Overview:
In analyzing the technical indicators for CUK stock over the last 5 days, we will delve into the trend, momentum, volatility, and volume indicators to provide a comprehensive outlook on the possible future stock price movement. By examining these key indicators, we aim to offer valuable insights and predictions for the upcoming trading days.
Trend Analysis:
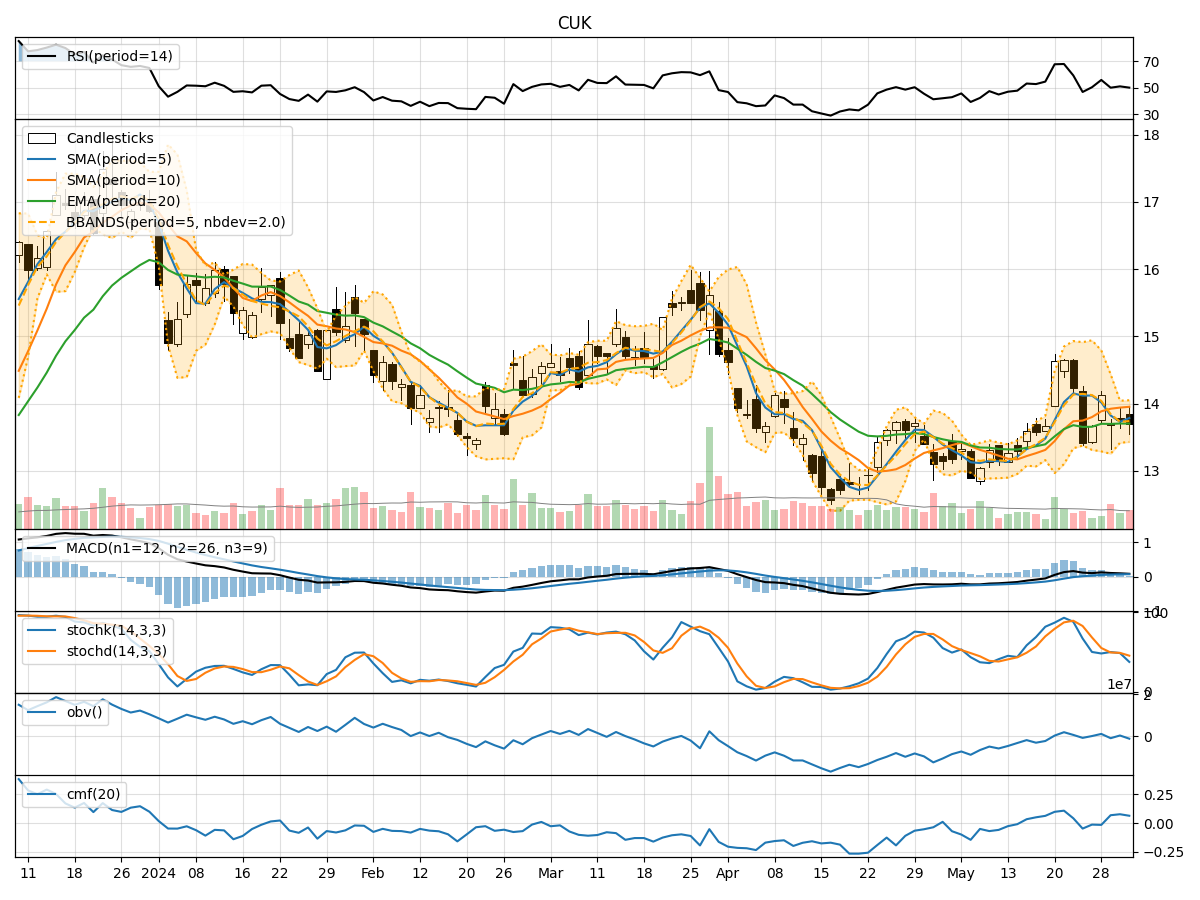
- Moving Averages (MA): The 5-day Moving Average (MA) has been fluctuating around the closing prices, indicating a lack of clear trend direction.
- MACD: The Moving Average Convergence Divergence (MACD) has been consistently negative, suggesting a bearish momentum in the short term.
- RSI: The Relative Strength Index (RSI) has been hovering around the mid-level, reflecting a neutral sentiment in terms of price momentum.
Key Observation: The trend indicators show a lack of strong directional bias, with a slight bearish inclination based on the MACD readings.
Momentum Analysis:
- Stochastic Oscillator: The Stochastic Oscillator readings have been fluctuating within the oversold and neutral zones, indicating indecision in the market.
- Williams %R: The Williams %R indicator has shown oversold conditions, suggesting a potential reversal in the short term.
Key Observation: Momentum indicators signal a mixed sentiment, with a slight bias towards a potential short-term reversal based on the Williams %R indicator.
Volatility Analysis:
- Bollinger Bands: The Bollinger Bands have been narrowing, indicating decreasing volatility in the stock price.
- Average True Range (ATR): The ATR values have been relatively stable, suggesting a lack of significant price fluctuations.
Key Observation: Volatility indicators point towards a period of consolidation and potential price stability in the near future.
Volume Analysis:
- On-Balance Volume (OBV): The OBV readings have been negative, indicating selling pressure in the market.
- Chaikin Money Flow (CMF): The CMF values have been consistently negative, reflecting a bearish money flow trend.
Key Observation: Volume indicators suggest a bearish sentiment, with higher selling volume and negative money flow.
Conclusion:
Based on the analysis of the technical indicators, the overall outlook for CUK stock in the next few days leans towards a bearish sentiment. The lack of clear trend direction, coupled with bearish signals from the MACD and volume indicators, indicates a potential downward movement in the stock price. Traders and investors should exercise caution and consider short-term selling strategies or wait for more definitive signals before entering new positions.
Key Conclusion:
- Overall Sentiment: Bearish
- Immediate Recommendation: Consider short-term selling strategies or wait for clearer signals.
- Potential Price Movement: Downward
By carefully monitoring the evolving market dynamics and key technical indicators, investors can make informed decisions to navigate the stock market effectively.